Time Zone: GMT +3
Time Frame: 4 Hours (H4)
Fundamental Analysis:
The AUD/USD exchange rates reflect economic activity and sentiment in both Australia and the United States. This pair, also known as the “Aussie,” has its news analysis today significantly impacted by the upcoming US CPI data release, as stronger-than-expected inflation figures would support a more hawkish Federal Reserve outlook, potentially boosting USD strength against the AUD. Additionally, a panel discussion by RBA Governor Michele Bullock at the Australian Securities and Investments Commission Annual Forum could provide insights into the Australian economy and potential future monetary policies. These events may create volatility in the AUD/USD forecast today as traders react to the Aussie’s economic outlook signals from the Reserve Bank of Australia, and the inflationary cues from the US.
Price Action:
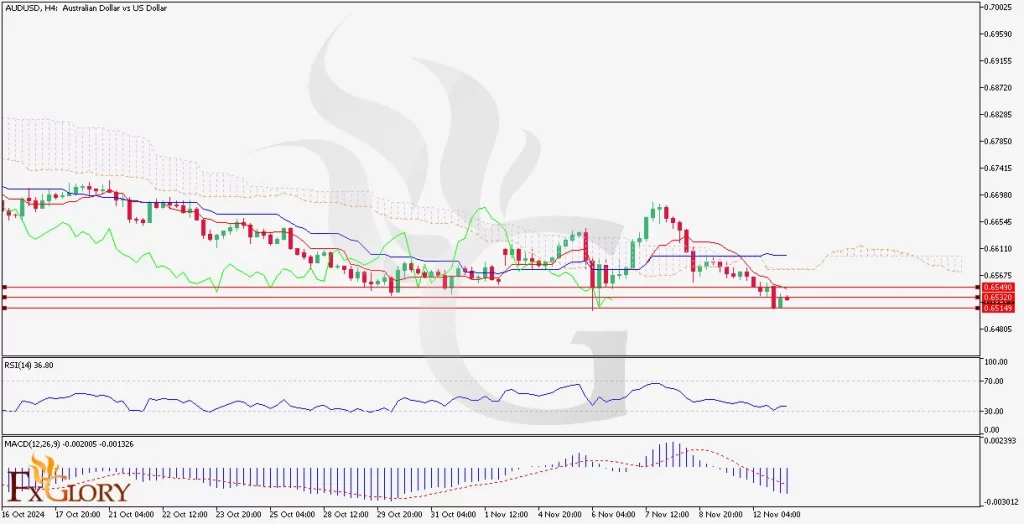
The AUD/USD H4 chart, shows the pair’s strong bearish trend, with the price currently trading below key support levels. The recent candles indicate selling pressure, as the AUDUSD price action continues to approach lower levels without significant bullish corrections. Any sustained movement below the current support could signal further bearish continuation, while a reversal or consolidation near the support levels may indicate possible stability or recovery attempts.
Key Technical Indicators:
Ichimoku Cloud: AUDUSD’s price is trading below the Ichimoku Cloud, indicating the pair’s bearish trend. The Tenkan-sen and Kijun-sen lines are also positioned to signal bearish momentum, while the Lagging Span remains below the price, reinforcing the downtrend. This setup supports the continuation of the bearish trend unless a breakout above the Cloud occurs.
RSI (Relative Strength Index): The RSI value is currently around 36.80, suggesting that the price is approaching oversold territory. This level indicates that selling momentum has been strong, but a reversal might occur if the RSI dips further and reaches oversold conditions.
MACD (Moving Average Convergence Divergence): The MACD line is below the signal line, with negative histogram bars, reflecting bearish momentum. The widening gap between the MACD and signal line indicates sustained selling pressure, which aligns with the Aussie’s bearish sentiment seen in its price action.
Support and Resistance:
Support Levels: Key support levels are positioned at 0.6520 and 0.6515. These levels could act as significant barriers for bearish movement. A break below these levels might open the door for further downside pressure.
Resistance Levels: Immediate resistance is located around 0.6543, with further resistance near the lower boundary of the Ichimoku Cloud. If the price breaks above these levels, it could challenge the bearish structure and potentially shift towards a more neutral or bullish bias.
Conclusion and Consideration:
The AUD/USD analysis today on its H4 chart is currently showing strong bearish indications, with the price trading near critical support levels. Given the bearish signals from the RSI, MACD, and Ichimoku Cloud, the pair’s outlook today remains negative unless support holds, or a breakout occurs above immediate resistance levels. Traders should monitor today’s US CPI release and RBA Governor Bullock’s remarks for potential shifts in market sentiment. These events could influence short-term movements, making risk management crucial. Using stop-losses and carefully observing price reactions near key support and resistance levels is advisable, especially given the increased volatility expected from today’s economic data.
Disclaimer: The provided analysis is for informational purposes only and does not constitute investment advice. Traders should conduct their own research and analysis before making any trading decisions.


