Time Zone: UTC (+03:00)
Time Frame: 4 Hours (H4)
Fundamental Analysis:
The GBP/USD, also known as “Cable,” reflects the exchange rate between the British Pound (GBP) and the US Dollar (USD). Today’s focus is on US unemployment claims data, which, if lower than expected, could boost the USD, putting pressure on GBP/USD. The Federal Reserve Bank of Cleveland President Beth Hammack is also scheduled to speak, and her remarks may hint at future US monetary policy, influencing market sentiment. Additionally, upcoming PMI data from the UK is crucial, as positive figures could support the GBP; however, any signs of contraction could weigh heavily on the pair. Moreover, with the Bank of England (BOE) participating in global discussions, market participants should watch for any policy updates or remarks that could create further volatility.
Price Action:
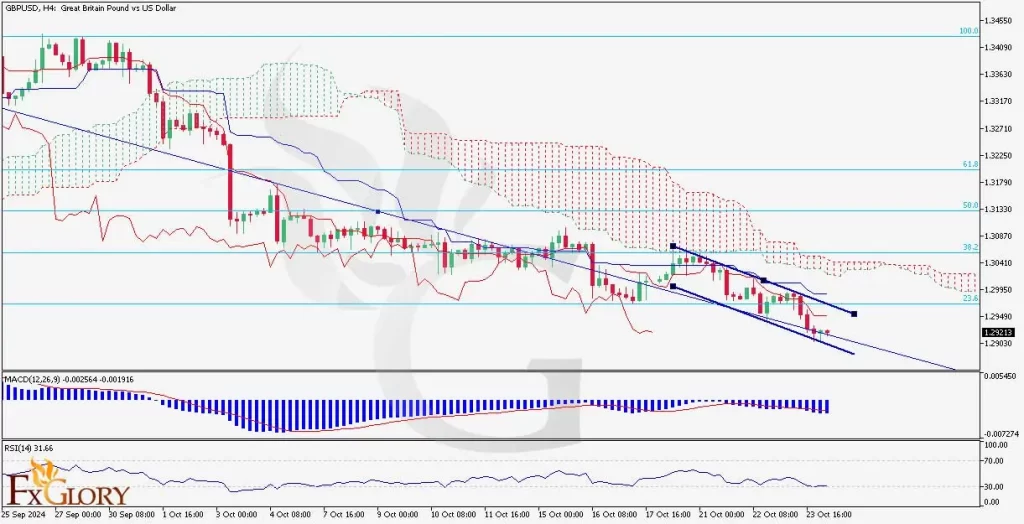
The GBP/USD pair shows a persistent downtrend in the H4 timeframe. The GBPUSD price has been consistently moving within a descending channel and is currently trading below the Ichimoku Cloud, indicating continued bearish pressure. The past few candles suggest some consolidation, but the pair remains under selling pressure as it fails to break above the cloud. The pair also hovers near the 23.6% Fibonacci retracement level, with strong resistance ahead. Given the current setup, the price could further test lower levels if selling momentum continues.
Key Technical Indicators:
Ichimoku Cloud: The GBP/USD forex pair is trading below the Ichimoku Cloud, confirming the bearish trend. The cloud is acting as overhead resistance, and the lagging span suggests that the bearish momentum could persist unless the price breaks above the cloud and the conversion line crosses the baseline.
MACD (Moving Average Convergence Divergence): The MACD indicator shows a bearish setup, with the MACD line remaining below the signal line. The histogram is in negative territory, signaling ongoing downward momentum, which aligns with the overall price action.
RSI (Relative Strength Index): The RSI stands at 31.66, indicating that the pair is nearing oversold conditions. Although this suggests potential for a short-term bounce or consolidation, the overall bearish trend remains dominant unless a reversal pattern is confirmed.
Support and Resistance:
Support: The nearest support level is located at 1.2900, which aligns with a recent low and the lower boundary of the descending channel. A break below this could open the path to further downside movement.
Resistance: Immediate resistance is observed at 1.3000, where the upper boundary of the descending channel and the Ichimoku Cloud overlap. A break above this level could signal a shift in momentum.
Conclusion and Consideration:
The GBP USD H4 analysis indicates a continuation of bearish momentum as long as the price remains below the Ichimoku Cloud and within the descending channel. Traders should closely monitor the upcoming US unemployment claims and speeches from key economic figures for clues on market direction. Given the current oversold levels on the RSI, there may be short-term opportunities for consolidation or a minor bounce; however, the dominant downtrend persists. It is advisable for traders to manage risk appropriately, as unexpected fundamental shifts, particularly from US data or UK economic indicators, could lead to volatility.
Disclaimer: The analysis provided for GBP/USD is for informational purposes only and does not constitute trading advice. Market conditions can change rapidly, and it is crucial for traders to conduct their own research and remain updated with the latest market information. Always practice proper risk management when trading forex markets.


