Time Zone: GMT +3
Time Frame: 4 Hours (H4)
Fundamental Analysis:
The BTC/USD pair represents the exchange rate between Bitcoin and the US Dollar. Today, market liquidity for BTC USD may be lower due to the Columbus Day holiday in the US, which typically results in less market activity. This could lead to irregular volatility in the cryptocurrency markets, especially with the absence of major institutional traders. However, volatility may pick up later as Neel Kashkari, the President of the Federal Reserve Bank of Minneapolis, is scheduled to speak about fiscal deficits and monetary policy at a conference in Argentina. His comments may offer insights into future US interest rate decisions, which could impact USD strength and, consequently, BTCUSD pair. In the coming days, the focus will be on any hawkish statements from other Federal Reserve officials, which could push the dollar higher and apply pressure on Bitcoin prices.
Price Action:
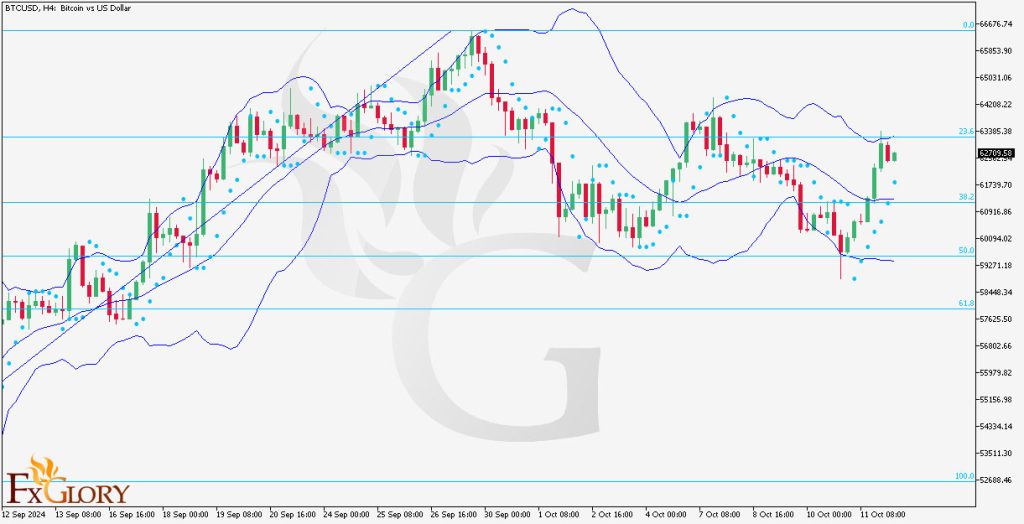
In the H4 time frame, BTCUSD has been showing signs of a bullish trend, as recent candles have been predominantly positive. The BTC USD price is currently moving between the 23.6% and 38.2% Fibonacci retracement levels, suggesting a continuation of the upward trend. After a strong push from the 50% Fibonacci level, the price broke above the 38.2% level and is now testing the 23.6% retracement, a key area of interest for traders. The BTCUSD price action suggests that buyers are regaining control, with the possibility of pushing the price higher if BTC-USD candle successfully holds above these retracement levels.
Key Technical Indicators:
Bollinger Bands: The BTC/USD price is trading within an upward trend, supported by widening Bollinger Bands, indicating increasing volatility. The price is moving closer to the upper band, signaling strong bullish momentum. Over the last few candles, the price has remained between the 38.2% and 23.6% Fibonacci retracement levels, which aligns with the positive price movement.
Parabolic SAR: The Parabolic SAR indicator shows a strong bullish sentiment, with the last seven dots forming below the candles. This indicates upward momentum and suggests that the current uptrend is likely to continue in the short term.
Support and Resistance Levels:
Support: Immediate support is located at $60,947 (50% Fibonacci level), followed by the next key support at $59,271 (61.8% Fibonacci level).
Resistance: Immediate resistance is seen at $63,385 (23.6% Fibonacci level). A break above this level could push BTC/USD toward the next psychological resistance near $66,000.
Conclusion and Consideration:
The BTCUSD forex pair shows strong bullish momentum on the H4 chart, supported by key indicators like Bollinger Bands and the Parabolic SAR, both signaling upward price movement. However, caution is advised due to irregular volatility stemming from the US bank holiday and potential market-moving comments from Federal Reserve officials. Traders should monitor the 23.6% Fibonacci resistance level closely, as a break above could open the doors for further gains. Additionally, market participants should stay alert to any sudden shifts in USD strength due to upcoming speeches that may affect interest rate expectations.
Disclaimer: The analysis provided for BTC/USD is intended for educational purposes and does not constitute financial advice. Traders should perform their own research and analysis before making any trading decisions. Market conditions can change rapidly, and it’s essential to stay updated on current events.