Time Zone: GMT +3
Time Frame: 4 Hours (H4)
Fundamental Analysis:
The AUD/USD forex trading pair, also known as the “Aussie”, continues to experience significant movements, as the pair’s fundamental forecast is influenced by various factors impacting both the Australian and US economies. Recently, US Federal Reserve officials, including Michelle Bowman and Neel Kashkari, have provided hawkish views regarding the US economy and future interest rate hikes. These statements are strengthening the USD, putting downward pressure on the Australian dollar. Moreover, a US Consumer Credit report is anticipated, which may further support the USD if consumer debt levels exceed expectations. In Australia, markets are adjusting to the observance of Labor Day in some states, contributing to lower liquidity and increased volatility. On the economic front, Melbourne Institute data on consumer price inflation is also relevant, as it could signal future adjustments in Australian monetary policy, especially given the RBA’s focus on inflation control.
Price Action:
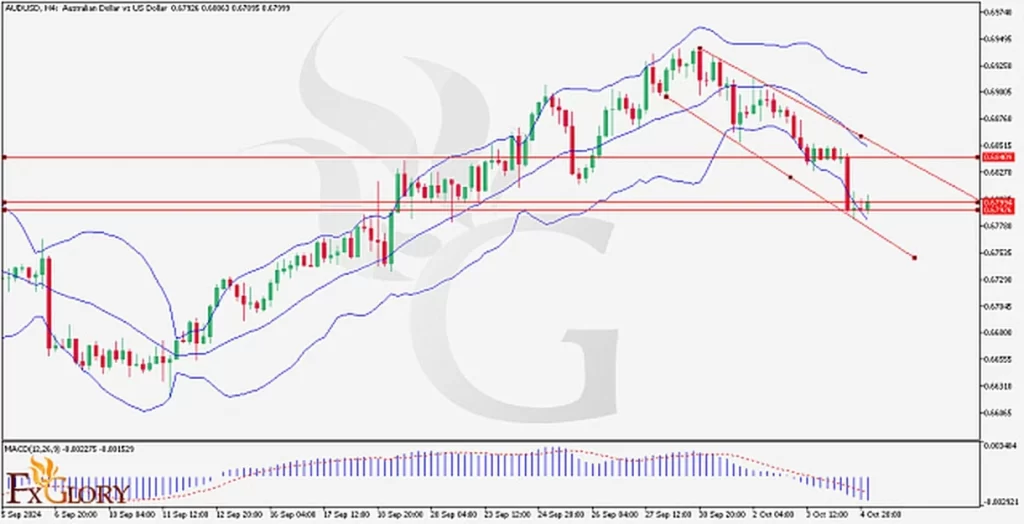
the AUD/USD H4 candle chart, shows the pair is trending downward within a well-defined bearish channel, having failed to break the upper resistance around 0.6840. The pair is currently trading near 0.6794, approaching a significant support level of 0.6770. The Aussi’s price action shows a clear pattern of lower highs and lower lows, confirming its bearish market sentiment. Buyers are attempting to regain control, but the prevailing market momentum suggests that the downtrend is still dominant.
Key Technical Indicators:
Bollinger Bands: The price is currently close to the lower Bollinger Band, which may act as a short-term dynamic support. The bands are widening, indicating increasing volatility in the market. A breakdown below the lower band could signify continued AUDUSD bearish pressure, while a bounce might suggest a temporary reversal or consolidation.
MACD (Moving Average Convergence Divergence): The MACD line has crossed below the signal line, with the histogram showing a growing negative divergence. This suggests that the bearish momentum is still intact, and further downside is likely unless there is a strong reversal in the coming sessions.
Support and Resistance:
Support Levels: The immediate support is at 0.6770, which aligns with recent price action and the lower Bollinger Band. If this level breaks, the next major support could be found around 0.6700, a key psychological level.
Resistance Levels: The closest resistance is at 0.6840, near the middle Bollinger Band. A successful breach above this level would suggest a potential recovery, but strong resistance is expected at the 0.6885 level.
Conclusion and Consideration:
The AUD/USD technical analysis today shows the ongoing bearish trend, supported by strong downward momentum in both the pair’s price action and its technical indicators. The widening Bollinger Bands and bearish MACD signal suggest that the pair may face further downward pressure, especially if the 0.6770 support level is breached. However, traders should be cautious of any potential rebounds from the lower Bollinger Band or support levels, which may trigger short-term corrections. The upcoming US economic data and Australian inflation reports could further influence the AUDUSD market direction. Given the current market conditions, employing risk management strategies, such as stop-loss orders, is crucial in navigating this volatile environment.
Disclaimer: The provided analysis is for informational purposes only and does not constitute investment advice. Traders should conduct their own research and analysis before making any trading decisions.