Time Zone: GMT +3
Time Frame: 4 Hours (H4)
Fundamental Analysis:
The EUR/USD forex pair, also known as “Fiber,” reflects the relative strength of the Eurozone and US economies. Currently, the market is focused on macroeconomic data such as employment figures, inflation rates, and central bank policies. Upcoming releases, such as France’s government budget balance and unemployment data across key European economies, are critical for Euro traders. On the US side, employment data (ADP) and Federal Reserve speeches will significantly impact the US Dollar’s performance. Any stronger-than-expected ADP job growth or hawkish Fed commentary could strengthen the USD, putting further pressure on the EUR/USD forecast today.
Price Action:
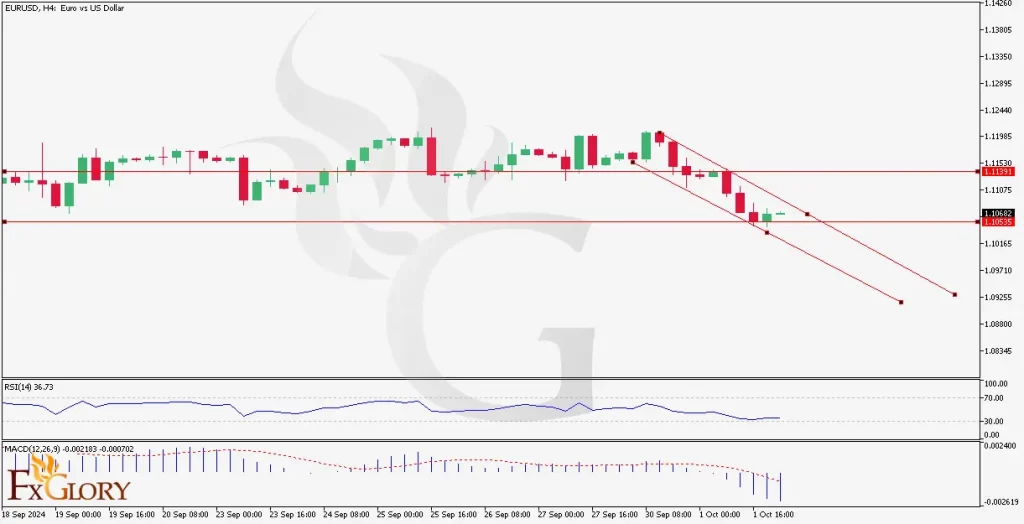
The EUR/USD H4 chart has been in a downtrend within a descending channel. The pair’s price action has been unable to breach the 1.1153 resistance level and is now testing support around 1.1068. The continuation of lower highs and lower lows within the channel indicates the Fiber’s strong bearish momentum, with no immediate signs of reversal. The price is hovering near the lower boundary of the channel, suggesting potential further downside movement if the support level breaks.
Key Technical Indicators:
RSI (Relative Strength Index):
The RSI is currently at 36.73, indicating the pair is approaching oversold conditions. While this suggests bearish momentum, it also implies that a relief rally could be on the horizon, especially if the RSI dips below 30.
MACD (Moving Average Convergence Divergence):
The MACD histogram is negative, with the MACD line below the signal line, reinforcing the pair’s bearish outlook. The increasing distance between the two lines suggests that bearish momentum is still strong, with no immediate signs of reversal.
Support and Resistance:
Support Levels: Immediate support is seen at 1.1068, followed by stronger support at 1.1005, which could act as a critical level if the bearish trend continues.
Resistance Levels: The nearest resistance stands at 1.1153, with the next significant resistance level around 1.1200 if the price manages to reverse the current downtrend.
Conclusion and Consideration:
The EUR/USD technical analysis today is displaying its strong bearish signals on the H4 timeframe, with both MACD and RSI indicators supporting the downward momentum. However, with the RSI nearing oversold conditions, a short-term pullback could be expected, but the overall EURUSD outlook remains bearish unless key resistance levels are breached. Traders should watch upcoming US employment data and Federal Reserve speeches for further direction. Risk management is crucial, especially given the volatile nature of the pair.
Disclaimer: The provided analysis is for informational purposes only and does not constitute investment advice. Traders should conduct their own research and analysis before making any trading decisions.
FXGlory
10.02.2024