Time Zone: GMT +3
Time Frame: 4 Hours (H4)
Fundamental Analysis:
The EUR/CAD pair is currently influenced by various economic developments. The Canadian Dollar’s movement is heavily tied to oil prices, and recent volatility in the oil market has caused fluctuations in the CAD. The Bank of Canada’s (BoC) decision to hold interest rates has also kept the CAD under pressure. Meanwhile, Eurozone data continues to show mixed results, with weaker industrial production in Germany. However, inflationary pressures persist in the Eurozone, adding complexity to the European Central Bank’s (ECB) future policy moves. Both these factors are shaping the EUR/CAD’s performance this week, with upcoming economic data releases and oil price movements playing a critical role.
Price Action:
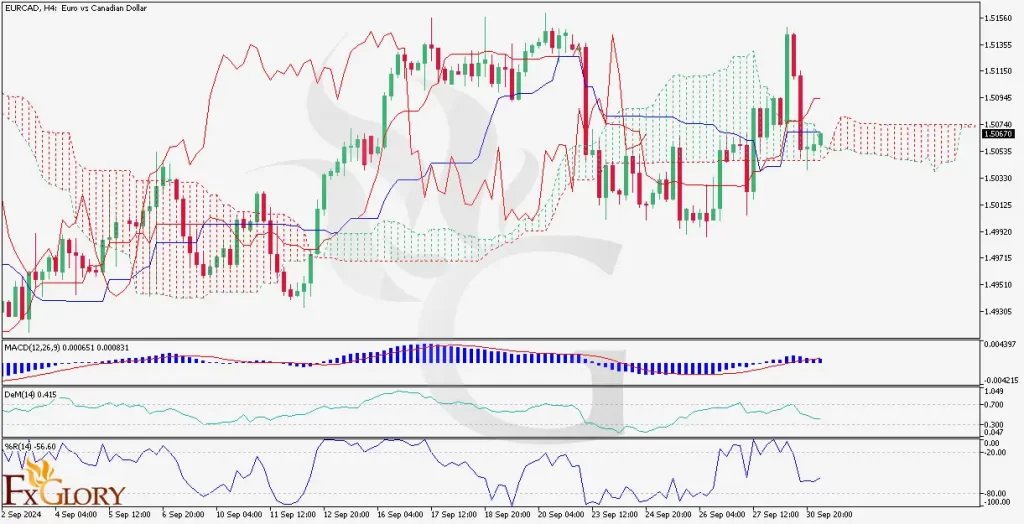
The EUR/CAD H4 chart indicates that the pair is trading in a consolidation phase after a recent bullish push. The price action shows a pullback from the 1.5170 resistance level and is currently hovering around the 1.5060 level. The pair is testing the lower boundary of a consolidation range, with key support at 1.4900. Bollinger Bands show decreased volatility, suggesting the potential for a breakout in the near term. Traders should watch for a decisive break either above the resistance at 1.5170 or below the 1.4900 support to determine the next move.
Key Technical Indicators:
William R%: The Williams %R on the EUR/CAD chart is near -56, indicating a neutral state with no strong overbought or oversold signals. A further drop below -80 could indicate oversold conditions, signaling potential buying opportunities.
MACD (Moving Average Convergence Divergence): The MACD is in bearish territory, with the MACD line below the signal line. The histogram is also below zero, supporting the bearish outlook. This indicates a potential for further downside if momentum doesn’t shift soon.
DeM (DeMarker Indicator): The DeMarker indicator is near 0.45, indicating that the pair is not in an oversold condition but may face continued selling pressure if it breaches key support levels.
Support and Resistance:
Support Levels: The immediate support is found at 1.4900, a psychological level that has acted as a strong base in previous sessions. Below this, 1.4850 could provide further support.
Resistance Levels: The nearest resistance is at 1.5170, a critical level that the pair has struggled to break. If EUR/CAD manages to close above this level, it could test the next resistance at 1.5270, marking the upper boundary of recent price action.
Conclusion and Consideration:
The EUR/CAD analysis suggests a cautious approach as the pair continues to consolidate near key support. Fundamental factors such as Canadian oil price movements and Eurozone inflation will play a significant role in shaping the direction of the pair. While technical indicators like the MACD and Bollinger Bands suggest the possibility of a breakout, traders should wait for confirmation before entering new positions. Prudent risk management is advised, with close attention to the 1.4900 support and 1.5170 resistance levels for potential breakout signals.
Disclaimer: The provided analysis is for informational purposes only and does not constitute investment advice. Traders should conduct their own research and analysis before making any trading decisions.