Time Zone: GMT +3
Time Frame: 4 Hours (H4)
Fundamental Analysis:
The GBP/USD pair is facing mixed market conditions today as the U.S. dollar is influenced by the release of the New York Manufacturing Index, which serves as a leading indicator of U.S. economic health. A higher-than-forecast reading would likely support the U.S. dollar. Meanwhile, in the UK, the Rightmove House Price Index (HPI) is in focus, which measures the change in asking prices for homes. Although the housing sector is less correlated to actual selling prices, it provides an early look into market conditions. With U.S. economic data expected to drive the dollar and UK housing data potentially offering limited support for the pound, traders can expect GBP/USD volatility today.
Price Action:
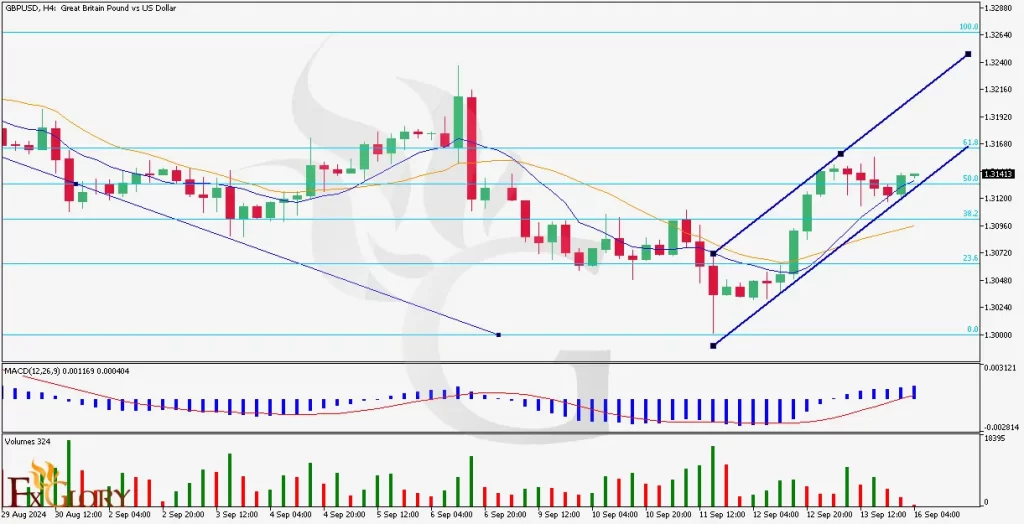
In the GBPUSD H4 chart, we observe an upward trend, with the price currently trading between the 50% and 61.8% Fibonacci retracement levels. This signals a continuation of the upward movement after a recent pullback. The GBPUSD price action shows bullish momentum as it attempts to break higher levels, with candles forming higher lows in the last few sessions. The pair appears to be trading within a rising channel, indicating further potential upside if support levels hold.
Key Technical Indicators:
Short SMA (9): The short-term moving average has crossed above the long-term moving average (SMA 17), suggesting bullish momentum in the medium term.
Long SMA (17): The long SMA shows gradual upward movement, reinforcing the continuation of the bullish trend as the price action respects this indicator as a dynamic support.
MACD: The MACD histogram shows growing bullish momentum, with the MACD line crossing above the signal line. This supports the possibility of further upward movement as buying pressure increases.
Volumes: Recent volume data shows increased buying interest, supporting the recent price surge. However, traders should watch for potential exhaustion if volume starts to decline.
Support and Resistance:
Support: The immediate support level is at 1.3070 (38.2% Fibonacci retracement), with a stronger base at 1.3040, aligning with the lower boundary of the channel.
Resistance: Key resistance stands at 1.3160 (61.8% Fibonacci retracement), followed by 1.3240, which marks the 100% Fibonacci extension.
Conclusion and Consideration:
GBP/USD continues to display bullish momentum, supported by technical indicators like the SMA crossover and MACD’s positive trend. With key support levels holding, the pair is likely to continue its upward trajectory. However, U.S. data releases could play a crucial role in determining the dollar’s strength, which might influence this trend. Traders should monitor upcoming news for both GBP and USD to gauge potential market reactions, particularly if the U.S. data exceeds forecasts.
Disclaimer: This GBP-USD analysis is for informational purposes only and does not constitute investment advice. Market conditions can change rapidly, and it’s important for traders to conduct their own research before making any trading decisions. Always consider market volatility and news events before entering any trade.