Time Zone: GMT +3
Time Frame: 4 Hours (H4)
Fundamental Analysis:
The USD/CAD forex pair represents the exchange rate between the U.S. dollar and the Canadian dollar, with both economies being heavily influenced by commodity prices, particularly oil. Recently, the U.S. dollar has experienced some fluctuations due to upcoming U.S. economic reports, such as unemployment claims and the Producer Price Index (PPI), both of which are crucial for gauging inflation and labor market conditions. For Canada, today’s focus is on oil inventories and the performance of the Canadian economy, heavily tied to global oil prices. Any unexpected movements in oil prices can have a direct impact on the Canadian dollar. As of now, the pair is in a tight range as traders await these key economic releases, with cautious sentiment dominating the market.
Price Action:
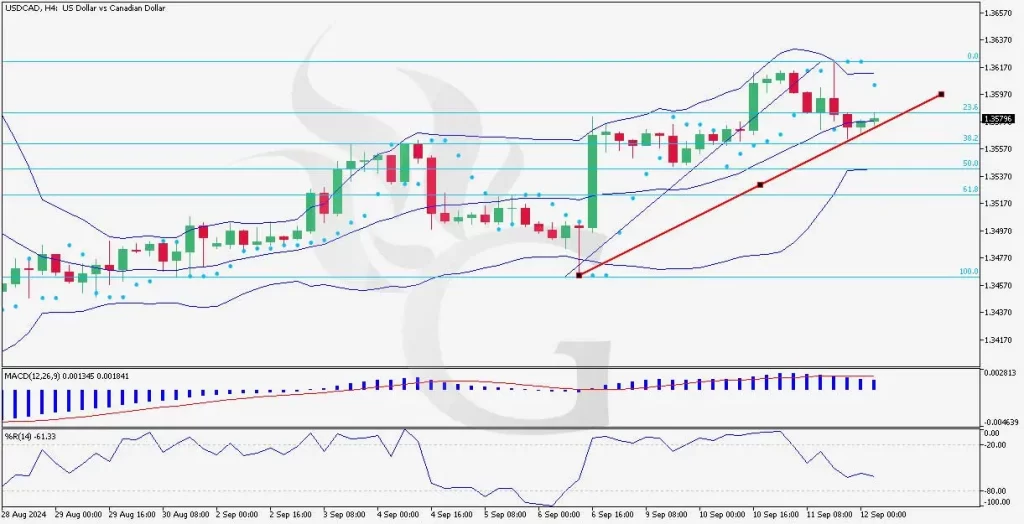
In terms of price action, the USD CAD pair has shown an upward trend over the past few sessions but is currently consolidating. It recently retraced from the upper Bollinger Band and has now touched the middle band, which appears to act as support. The last two candles are bullish, indicating potential upward momentum. However, the presence of the Parabolic SAR dots above the price suggests caution, as this can indicate selling pressure. The price is fluctuating between the 38.2% and 23.6% Fibonacci retracement levels, with resistance near the 23.6% level. A break above this level could signal a continuation of the upward trend.
Key Technical Indicators:
Bollinger Bands: The price has moved from the upper band towards the middle band, which is acting as a dynamic support. Currently, the price is showing signs of a potential bounce as the last two candles have turned bullish, indicating that the middle Bollinger Band has provided temporary support.
Parabolic SAR: The last three Parabolic SAR points are positioned above the candles, which signals potential downward pressure. However, since the price is still holding above key support levels, traders should watch for a reversal signal if the dots shift below the price.
MACD: The MACD indicator is currently showing weakening bullish momentum. The histogram is positive but shrinking, indicating that while the uptrend remains, momentum has slowed. A potential bearish crossover could occur if this trend continues, signaling a potential downside move.
%R (Williams %R): The %R is currently around -61, indicating that the market is neither overbought nor oversold. This neutral level suggests there is still room for price action to go either way, depending on market sentiment and upcoming fundamental factors.
Support and Resistance Levels:
Support: Immediate support can be seen near the 38.2% Fibonacci retracement level around 1.3550, followed by more substantial support near the 50% Fibonacci level at 1.3520.
Resistance: The nearest resistance is the 23.6% Fibonacci level at 1.3590. A successful breach of this level could pave the way toward the next resistance at 1.3630, which coincides with the recent swing highs.
Conclusion and Consideration:
The USD-CAD pair is showing mixed signals on the H4 chart. While the price action indicates a possible continuation of the upward trend after bouncing off the middle Bollinger Band, the technical indicators such as the Parabolic SAR and weakening MACD suggest caution. Traders should closely monitor the price’s behavior around the 23.6% Fibonacci level for a potential breakout, while also keeping an eye on upcoming economic releases for both the U.S. and Canada. With upcoming news such as U.S. unemployment claims and Canadian oil inventories, volatility can be expected, which could further influence the pair’s direction.
Disclaimer: This analysis is intended for informational purposes only and should not be considered as financial advice. Always conduct your own research before making trading decisions. Market conditions can change rapidly, and it is important to stay informed of the latest developments.