Time Zone: GMT +3
Time Frame: 4 Hours (H4)
Fundamental Analysis:
Upcoming economic data releases from both the U.S. and New Zealand will play a crucial role in determining the future direction of the NZD/USD pair. On the U.S. side, the most anticipated releases include the Core CPI m/m, which is expected to remain steady at 0.2%, and the overall CPI y/y, expected to dip slightly from 2.9% to 2.5%. These inflation figures are significant in shaping the Federal Reserve’s monetary policy outlook and could strengthen or weaken the USD depending on the outcome. Crude Oil Inventories and the 10-y Bond Auction are also on the calendar, with lower oil inventories potentially lifting crude prices, which could influence inflationary expectations.
For New Zealand, the Food Price Index (FPI) is expected to show a modest increase of 0.4%. Although not a major economic indicator, any significant deviation could impact the NZD slightly, especially in the absence of other major economic data. Overall, the combination of U.S. inflation data and New Zealand’s FPI may contribute to a period of volatility for the NZD/USD pair.
Price Action:
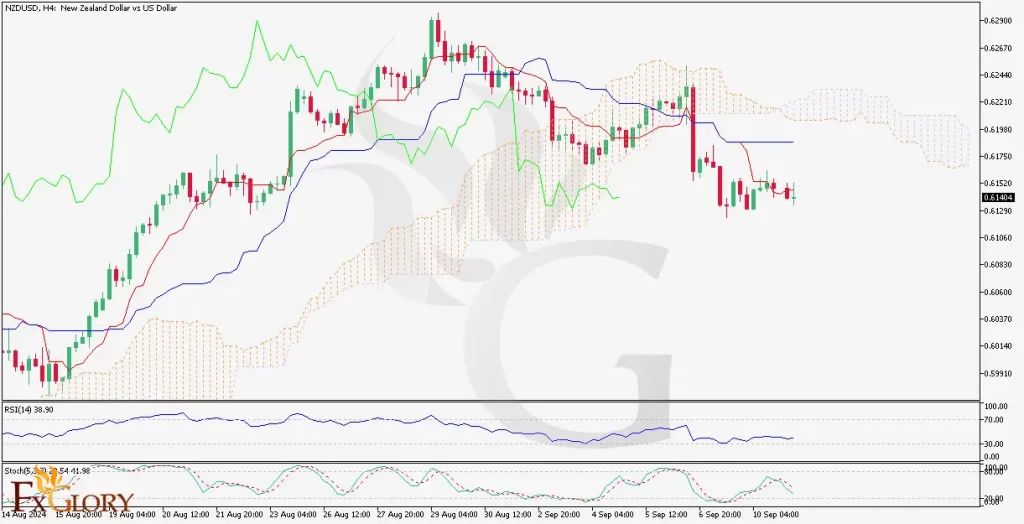
The NZD/USD price line recently broke below the Ichimoku cloud, indicating a shift to bearish sentiment on the H4 chart. The price action has been forming lower highs and lower lows, a typical characteristic of a downtrend. With the RSI hovering below the 40 level and the stochastic oscillator nearing oversold territory, there is strong potential for continued bearish momentum. Traders should watch for further declines as the bearish structure remains intact, especially if the price fails to break back above the Ichimoku cloud.
Key Technical Indicators:
RSI: The RSI is currently at 38.90, indicating bearish sentiment but not yet oversold. There is room for the pair to continue its downward move before a reversal is likely.
Stochastic: The stochastic oscillator is reading at 29.54 and 41.98, showing potential for a bearish crossover, which could signal continued selling pressure.
Ichimoku Cloud: The price has broken below the Ichimoku cloud, suggesting that the pair is firmly in a bearish trend. A failure to break back above the cloud could lead to further downside.
Support and Resistance:
Support Levels: The nearest support is at 0.6100, which could act as a crucial level to watch for any bearish continuation. A break below this level may see the price heading toward the 0.6050 region.
Resistance Levels: Immediate resistance is at 0.6175, near the lower boundary of the Ichimoku cloud. A break above this level would signal a potential end to the bearish phase, targeting the next resistance at 0.6200.
Conclusion and Consideration:
The NZD/USD H4 chart signals a clear bearish trend with the price breaking below the Ichimoku cloud and forming lower highs and lower lows. Traders should watch the upcoming U.S. CPI data closely, as any surprises could significantly impact the USD and further drive the pair’s movement. On the technical side, as long as the price remains below the cloud, bearish momentum is expected to continue. A break below the support at 0.6100 could accelerate the decline, while a move back above the resistance at 0.6175 would signal a potential shift in sentiment.
Disclaimer: The provided analysis is for informational purposes only and does not constitute investment advice. Traders should conduct their own research and analysis before making any trading decisions.