Time Zone: GMT +3
Time Frame: 4 Hours (H4)
Fundamental Analysis:
Upcoming economic data releases from both the UK and Australia will play a crucial role in predicting the direction of the GBP/AUD pair. Key releases for the GBP currency include Claimant Count Change, Average Earnings Index 3m/y, and the Unemployment Rate. The Claimant Count Change is expected to show an improvement from 135K to 95.5K, suggesting a slight improvement in the UK labor market. Average Earnings Index 3m/y is forecasted to dip from 4.5% to 4.1%, indicating weaker wage growth. The Unemployment Rate is projected to hold steady at 4.1%, which may keep investor confidence intact but limits any significant bullish move in the GBP.
On the Australian side, the Westpac Consumer Sentiment data, along with the NAB Business Confidence report, is expected to provide insights into the current economic outlook. If both data sets show improving confidence, it could strengthen the AUD in the short term.
Price Action:
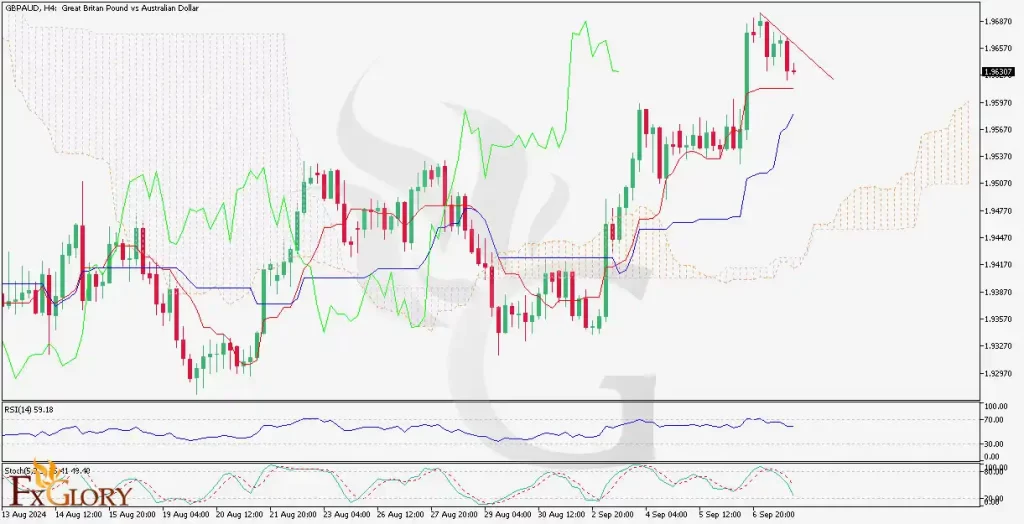
The GBP/AUD price line has entered a correction phase after a strong bullish wave. Currently, the price is consolidating above the Ichimoku cloud, which suggests that bullish sentiment may remain dominant in the near future. RSI (Relative Strength Index) is not yet in the overbought area, and the stochastic indicator shows that the bearish momentum is nearly exhausted. Traders should keep an eye on the bearish trend line within this correction phase, as a breakout above this area could signal the continuation of the bullish trend.
Key Technical Indicators:
RSI: The RSI is hovering below the overbought level, suggesting more room for upward movement before reaching overextended conditions.
Stochastic: The stochastic oscillator is showing signs of reaching the end of a bearish run, hinting at a potential bullish crossover.
Ichimoku Cloud: The price has broken above the cloud, which is a bullish signal, and could indicate further upside if the price sustains above this area.
Support and Resistance:
Support Levels: The nearest support is at 1.9500, just above the lower boundary of the Ichimoku cloud. A break below this level could signal further bearish correction toward 1.9450.
Resistance Levels: Immediate resistance is at the descending trend line formed in the current correction phase. A breakout above 1.9600 could confirm a continuation of the bullish trend, targeting the next resistance around 1.9700.
Conclusion and Consideration:
The GBP/AUD H4 chart suggests that while the pair is undergoing a corrective phase, the overall sentiment remains bullish due to the price holding above the Ichimoku cloud. If the price breaks above the current descending trend line during this correction, bulls are likely to take over the market again. Traders should also pay close attention to upcoming GBP and AUD economic data releases, as these can highly influence the pair’s movement in the short term.
Disclaimer: The provided analysis is for informational purposes only and does not constitute investment advice. Traders should conduct their own research and analysis before making any trading decisions.