Time Zone: GMT +3
Time Frame: 4 Hours (H4)
Fundamental Analysis:
The USDCAD pair remains sensitive to key economic releases from both the U.S. and Canada. On the U.S. side, today’s Non-Farm Payrolls (NFP) and unemployment data will have a major impact on the U.S. Dollar’s strength. Positive employment data can strengthen the Dollar as it signals economic growth and could lead to further interest rate hikes by the Federal Reserve. Additionally, any hawkish commentary from Federal Reserve officials, including John Williams and Christopher Waller, will be closely watched for clues on monetary policy direction. On the Canadian side, the upcoming employment and unemployment data are key drivers for the Canadian Dollar. Better-than-expected employment figures can boost the CAD, indicating stronger economic activity in Canada. These releases will likely bring increased volatility to the USD/CAD forex pair.
Price Action:
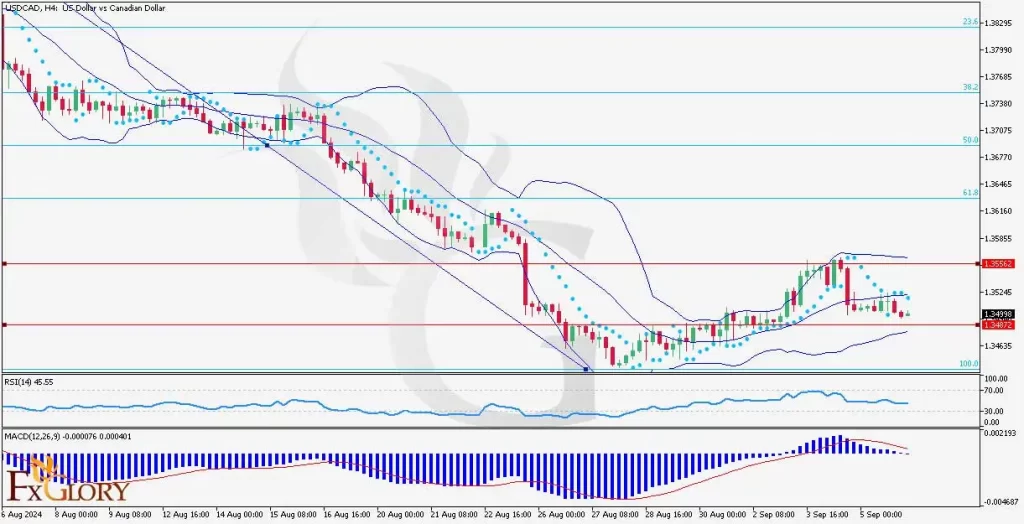
On the H4 chart, the USD CAD is currently in a bearish trend, trading below the 50% Fibonacci retracement level. Over the last few sessions, the price has been consolidating between the 1.34827 support and the 1.35562 resistance level. The pair briefly attempted to recover but has since retraced and is now hovering near the lower Bollinger Band. The bearish pressure is strong, though a potential bullish correction could be on the horizon if key support levels hold.
Technical Indicators:
Bollinger Bands: The USD-CAD price is in the lower half of the Bollinger Bands, indicating bearish pressure. It is trying to move closer to the middle band, signaling a possible consolidation phase. The bands have widened recently, indicating increased volatility, which may precede a breakout in either direction.
Parabolic SAR: The Parabolic SAR dots have recently flipped above the candles, indicating that the current trend is bearish. Traders should watch for any reversal signals that could emerge if the price moves above key levels.
RSI (Relative Strength Index): The RSI is at 45.55, which is below the 50 neutral mark but far from the oversold territory. This suggests that while the bearish momentum is intact, there may still be room for further downside before the market becomes oversold.
MACD (Moving Average Convergence Divergence): The MACD histogram is slightly below the zero line, showing weak bearish momentum. The MACD line remains below the signal line, but any potential crossover could indicate the beginning of a bullish correction.
Support and Resistance Levels:
Support: The immediate support is located at 1.34827. A break below this level could open the door for further downside, potentially targeting the next key support at 1.34000.
Resistance: The nearest resistance is at 1.35562. If the price manages to break above this level, it could trigger a bullish correction towards the next resistance at 1.36300.
Conclusion and Consideration:
The USDCAD H4 chart shows a clear bearish bias, with key indicators like the Bollinger Bands, Parabolic SAR, and MACD signaling downward momentum. However, upcoming fundamental data, especially from the U.S. labor market and Canadian employment figures, will likely play a critical role in determining the pair’s next move. Traders should remain cautious and monitor support and resistance levels closely, as a break could signal a shift in momentum. Additionally, news from Federal Reserve officials may provide further insight into the USD’s potential strength.
Disclaimer: The analysis provided here is for informational purposes only and does not constitute financial advice. Trading Forex involves significant risk, and traders should conduct their own research or consult with a professional before making any trading decisions. Always stay updated on the latest market conditions, as they can change rapidly.