Time Zone: GMT +3
Time Frame: 4 Hours (H4)
Fundamental Analysis:
As of the latest market insights, Silver trading against the US Dollar (XAGUSD) on the H4 timeframe shows nuanced movements ahead of significant economic data releases. Today, US economic indicators such as job cut announcements, ADP employment change, and initial jobless claims could sway the USD strength significantly. Favorable reports are expected to bolster the USD, exerting downward pressure on Silver prices. Conversely, weaker data may enhance Silver’s appeal as a hedge, pushing prices upward. Investors and traders should remain vigilant to these updates to gauge potential market directions effectively.
Price Action:
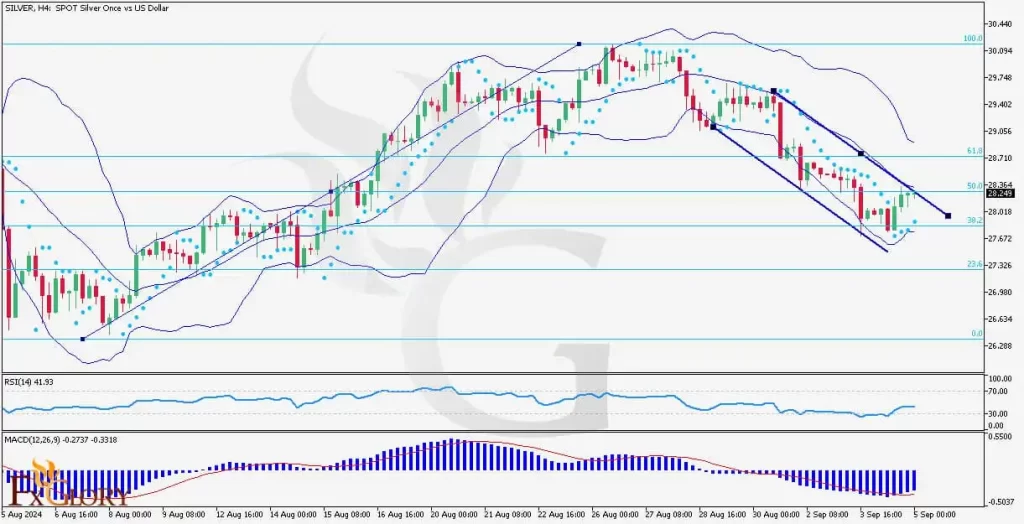
On the H4 chart, Silver has been navigating a challenging terrain marked by a descending channel, showcasing a bearish trend that recently attempted a reversal. The Silver USD price action near the middle Bollinger Band indicates a struggle between bears and bulls, with recent candles attempting to break above this resistance. The near-touch of the Fibonacci 50% retracement level suggests a potential shift in momentum if sustained buying pressure continues, pointing to an upcoming test of higher resistance levels.
Key Technical Indicators:
Bollinger Bands: The Silver price has been predominantly in the lower half of the bands but recently rebounded from the lower band towards the middle. This movement indicates a possible alleviation of the selling pressure, with the current Silver price attempting to breach the middle band—a crucial pivot for further bullish signals.
Parabolic SAR: Recent dots positioned below the candles signify a potential reversal from the prior downtrend. This indicator suggests that the downtrend momentum is losing strength, and a bullish sentiment might be developing, especially as the price approaches the middle Bollinger Band and the Fib 50% level.
RSI (Relative Strength Index): With a reading of 41.93, the RSI indicates that the market is neither oversold nor overbought, leaving room for potential upward movement if buying pressure increases.
MACD (Moving Average Convergence Divergence): The MACD line remains below the signal line, indicating ongoing bearish momentum. However, the decreasing histogram bars may suggest that the bearish momentum is weakening, aligning with the potential shift suggested by other indicators.
Support and Resistance Levels:
Support Levels: Immediate support is found at the 23.6% Fibonacci retracement level, around $27.322, where previous lows have consolidated.
Resistance Levels: Initial resistance is observed at the 38.2% Fibonacci level, near $28.018. A breach above this could test the 50% level at approximately $28.710, which aligns with the middle Bollinger Band.
Conclusion and Consideration:
The Silver/ XAGUSD market on the H4 chart presents a complex scenario, balancing between bearish trends and emerging bullish signals. The approaching economic data from the US could serve as a catalyst for significant price movements. Traders should monitor these indicators closely, considering both the technical setups and external economic factors influencing market dynamics.
Disclaimer: This Silver USD analysis is provided for informational purposes only and does not constitute investment advice. Investors should conduct their due diligence and consider their financial position before engaging in trades based on this analysis.