Time Zone: GMT +3
Time Frame: 4 Hours (H4)
Fundamental Analysis:
The EUR/USD currency pair is experiencing notable fluctuations influenced by a mix of European economic data and US market dynamics. Today’s EURUSD calendar includes significant releases like the Real Retail Sales from Germany and the French General Budget Outcome, both pivotal in shaping the Euro’s trajectory. Concurrently, the speech by Deutsche Bundesbank President Joachim Nagel is highly anticipated, with potential implications on the Euro’s strength depending on the tone and content regarding future monetary policy. Across the Atlantic, the US market awaits the PMI data, which is a critical economic health indicator. Such data can directly impact the USD’s strength against a backdrop of global economic uncertainties.
Price Action:
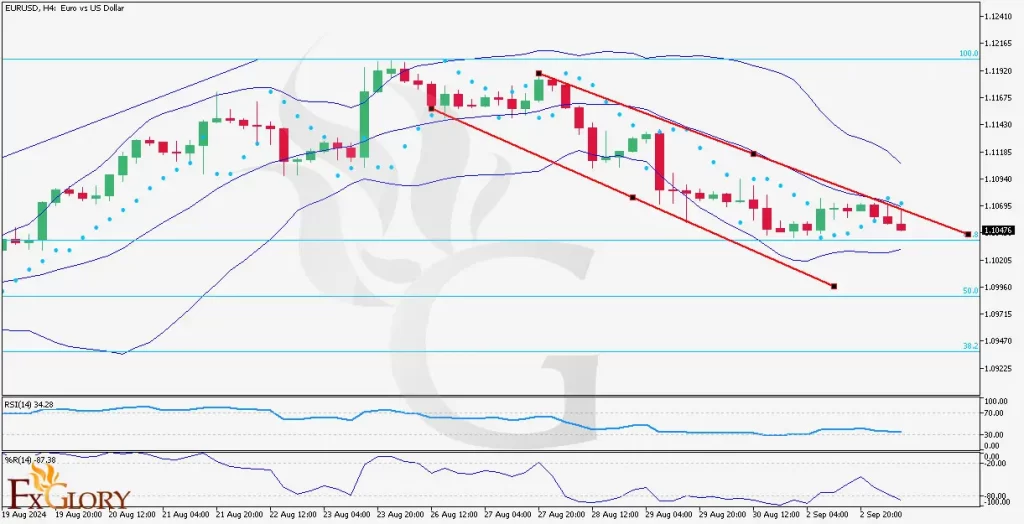
The EUR/USD Price Action has shown a consistent bearish trend on the H4 chart, marked by a descending channel pattern. Recent sessions have recorded a narrow oscillation between the middle and lower Bollinger Bands, indicative of bearish momentum with intermittent stability. The last three candles, specifically bearish, reinforce the downtrend, hinting at potential continued bearish pressure if the upper resistance of the channel holds.
Key Technical Indicators:
Bollinger Bands: The EUR/USD’s price movement within the Bollinger Bands displays a bearish trend, as it hovers between the middle and lower bands. The narrowing of the bands slightly suggests a decrease in market volatility and a potential consolidation phase could be nearing.
Parabolic SAR: Indicative dots positioned above the candles signal continued bearish dominance, aligning with the overall downtrend observed in the price channel.
RSI (Relative Strength Index): With an RSI value at 34.28, the market is nearing oversold territory, suggesting a potential slowdown in the bearish momentum or a forthcoming bullish correction.
%R (Williams Percent Range): The %R indicator at -87.38 further corroborates the strong bearish momentum, as it lies close to the extreme end of its range, signaling that the market might be oversold.
Support and Resistance Levels:
Support: The nearest significant support level is observed around 1.09470, which aligns with historical lows and the lower Bollinger Band.
Resistance: Resistance can be found at approximately 1.11095, coinciding with the channel’s upper boundary and the middle Bollinger Band.
Conclusion and Considerations:
The EUR/USD pair is currently in a bearish phase, indicated by both price action and key technical indicators within the H4 timeframe. Investors should remain cautious, as the upcoming economic announcements from both Europe and the United States could inject significant volatility and potentially alter the currency pair’s direction. Traders are advised to watch for any breakout above the channel resistance or a bounce from support levels as key signals for short-term trading opportunities.
Disclaimer: The EUR/USD H4 analysis is provided as a general market commentary and does not constitute investment advice. Financial trading involves risks, including the potential loss of principal. Investors should conduct their own research or consult a professional advisor before making any investment decisions. Changes in market conditions can occur rapidly, requiring constant review and adaptation of strategies.