Time Zone: GMT +3
Time Frame: 4 Hours (H4)
Fundamental Analysis:
The EUR/GBP news analysis today is influenced by a range of macroeconomic factors, including economic data from both the Eurozone and the United Kingdom. Current data shows that the Eurozone’s retail sales and PMI figures are pivotal, indicating consumer spending trends and manufacturing sector health. Strong retail sales data and PMI readings above 50 suggest economic expansion, which could support the Euro. Conversely, the UK’s economic outlook is monitored through PMI reports, where values below 50 indicate contraction. Today’s PMI release could significantly impact GBP’s strength, with positive figures bolstering the currency and negative data exerting downward pressure, all of which affecting the pair that’s also known as the “Chunnel.”
Price Action:
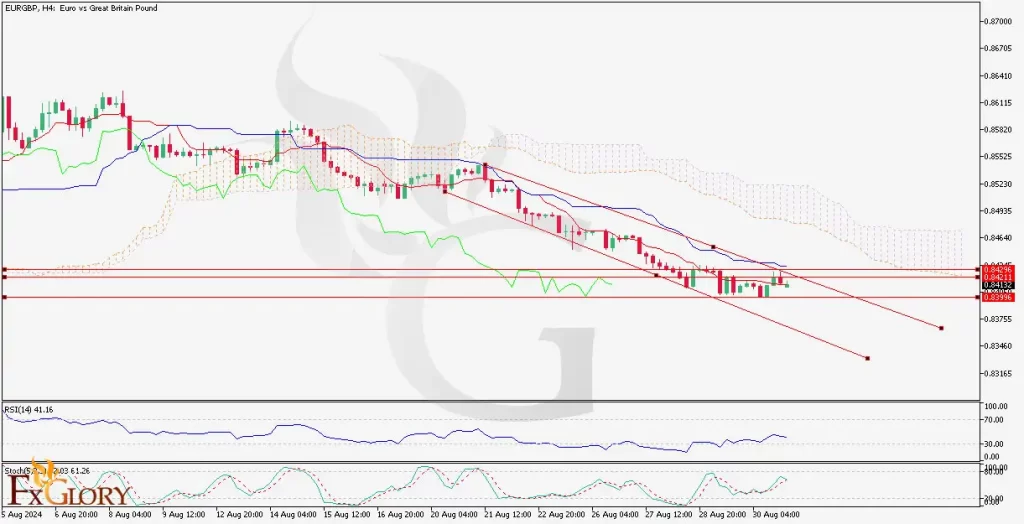
The EUR/GBP H4 chart indicates the pair’s bearish trend that has been dominant in recent sessions, characterized by a series of lower highs and lower lows. However, the price appears to be consolidating within a downward-sloping channel, suggesting a potential for a breakout or further consolidation. The Chunnel’s price action shows it as trending below the Ichimoku Cloud, highlighting its bearish sentiment. A breakout from the consolidation phase could provide a clearer directional bias.
Key Technical Indicators:
Ichimoku Cloud: The EUR/GBP price is trading below the Ichimoku Cloud, indicating that the bearish trend remains intact. The cloud acts as a resistance area, and the distance below the cloud suggests strong selling pressure. The Lagging Span is also below the price action, confirming the pair’s bearish outlook.
RSI (Relative Strength Index): The RSI is currently around 41, which is below the neutral 50 level. This position reflects the current bearish momentum. However, it is not yet in the oversold territory, indicating that there could be more room for the price to fall before reaching extreme conditions.
Stochastic Oscillator: The Stochastic oscillator shows a reading near 62, suggesting that while the market is not overbought, there is potential for minor bullish corrections before continuing the bearish trend. Crossovers of the signal line could indicate short-term entry points for traders.
Support and Resistance:
Support Levels: The immediate support is identified at 0.8396, with a stronger support level around 0.8389. These levels have been tested multiple times, indicating their significance in the current market.
Resistance Levels: On the upside, resistance is noted at 0.8421, which aligns with recent price highs and the upper boundary of the descending channel. A break above this level could lead to a retest of the 0.8442 area.
Conclusion and Consideration:
The EUR/GBP technical analysis today on the H4 chart is currently showing a bearish trend, with the price trading below the Ichimoku Cloud, reflecting ongoing selling pressure. The consolidation within the descending channel suggests indecision, but the bearish momentum remains dominant. Key economic data releases that affect the pair’s fundamental analysis, such as PMI figures, could provide the necessary catalyst for a breakout. Traders should monitor these indicators closely, as well as upcoming support and resistance levels, for signs of a reversal or continuation of the trend. Risk management strategies, such as setting stop-loss orders, are advised due to potential volatility around economic data releases.
Disclaimer: The provided analysis is for informational purposes only and does not constitute investment advice. Traders should conduct their own research and analysis before making any trading decisions.