Time Zone: GMT
Time Frame: 4 Hours (H4)
Fundamental Analysis:
The Australian Dollar (AUD) against the US Dollar (USD) is experiencing potential volatility due to key economic events scheduled today. In the US, the market will closely watch Raphael Bostic’s speech at the Federal Reserve Bank of Atlanta, where his comments may provide insights into future monetary policy directions, affecting the USD’s strength. Moreover, important data releases like the GDP Second Release and Unemployment Claims are expected, which can offer clues about the US economy’s health and labor market. On the AUD side, no major economic releases are scheduled for today, which may keep the currency influenced primarily by external factors, especially from the USD.
Price Action:
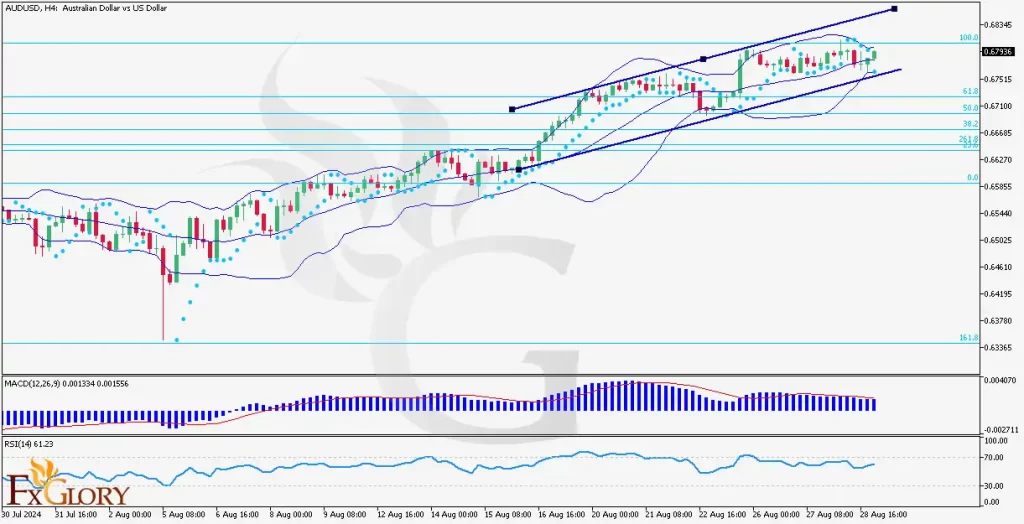
The AUDUSD forex pair is showing a bullish trend on the H4 chart. The pair is trading within an ascending channel, with the recent candles moving towards the upper boundary. The last two candlesticks have shown positive movement, with the most recent candle being bullish, indicating sustained upward momentum. The AUD/USD price is currently moving between the 61.8% and 100% Fibonacci retracement levels, edging closer to the 100% mark. This suggests a strong upward bias, with the potential to test higher resistance levels.
Key Technical Indicators:
Bollinger Bands: The Bollinger Bands have tightened, indicating reduced volatility and a potential buildup for a breakout. The price has been trading in the upper half of the bands and is now near the upper band, suggesting that the bullish momentum is still intact. This position implies a higher probability of further upward movement in the AUD USD price. However, traders should watch for any signs of reversal as the price approaches the upper band limit.
MACD (Moving Average Convergence Divergence): The MACD line is positioned above the signal line, and the histogram is showing positive but decreasing momentum. This indicates that while the bullish trend persists, the strength behind the movement is diminishing. Forex traders should watch for any potential crossover, which could signal a shift in momentum and a possible price correction in the AUD/USD pair.
RSI (Relative Strength Index): The RSI is currently at 61.23, which is below the overbought threshold of 70. This suggests that there is still room for upward movement before the AUD-USD reaches overbought conditions. The RSI supports the ongoing bullish trend and indicates that the market is not overly stretched.
Parabolic SAR: The Parabolic SAR dots have shifted below the price, indicating a bullish trend. This shift supports the upward movement, with the dots acting as potential support levels. As long as the Parabolic SAR remains below the price, the bullish bias in the AUD USD is likely to continue.
Support and Resistance Levels:
Support: The immediate support is at the 61.8% Fibonacci level, around 0.67100, followed by stronger support near 0.66865, which aligns with the 50% retracement level.
Resistance: The primary resistance is at the 100% Fibonacci retracement level, approximately 0.68345. If the price breaks above this level, the next target could be the upper boundary of the ascending channel.
Conclusion and Consideration:
The AUDUSD pair on the H4 chart shows continued bullish momentum, underpinned by positive price action and supported by the technical indicators like Bollinger Bands, MACD, RSI, and Parabolic SAR. While the trend remains upward, caution is advised due to the tightening Bollinger Bands and the decreasing momentum shown by the MACD histogram. Upcoming economic events and data releases, especially from the US, could introduce volatility and influence price movements. Traders should monitor these developments closely and consider employing risk management strategies to navigate potential market fluctuations.
Disclaimer: This AUDUSD analysis is for informational purposes only and does not constitute investment advice. Traders should conduct their own research and analysis before making any trading decisions. Market conditions can change rapidly, and it is essential to stay updated with the latest information.