Time Zone: GMT +3
Time Frame: 4 Hours (H4)
Fundamental Analysis:
The EUR/USD pair, reflecting the exchange rate between the Euro and the US Dollar, is currently navigating through various economic data releases from both the Eurozone and the United States. In the Eurozone, inflation data has presented a mixed picture. Germany’s Preliminary Consumer Price Index (CPI) came in flat at 0.0% for the month, below expectations of a 0.3% increase, suggesting subdued inflationary pressures in Europe’s largest economy. Meanwhile, Spain’s Flash CPI showed a year-on-year increase of 2.4%, which is below the anticipated 2.8%, indicating lower inflationary momentum than expected. These figures suggest that inflation concerns might be less pronounced in the Eurozone, possibly leading to a more dovish stance from the European Central Bank.
On the US side, economic indicators such as the Preliminary Gross Domestic Product (GDP) q/q showed a stable 2.8% growth rate, aligning with market expectations. This stability is indicative of a resilient economic outlook in the US. Additionally, the Unemployment Claims remained consistent at 232K, further reinforcing a stable labor market. The Preliminary GDP Price Index, also stable at 2.3%, aligns with market forecasts, indicating controlled inflation in the US. These stable economic indicators in the US might support the Federal Reserve’s current monetary policy stance, impacting the USD’s strength relative to the Euro.
On the Japanese side, the Services Producer Price Index (SPPI) y/y is forecasted to slightly decrease from 3.0% to 2.9%, signaling a potential slowdown in price pressures; which stands as an important forecast element for this fore pair. The BOJ Core CPI y/y is expected to remain stable at 2.1%, suggesting persistent inflation concerns within Japan. The stable inflation rate and the recent dovish stance of the Bank of Japan could continue to exert downward pressure on the JPY.
Price Action:
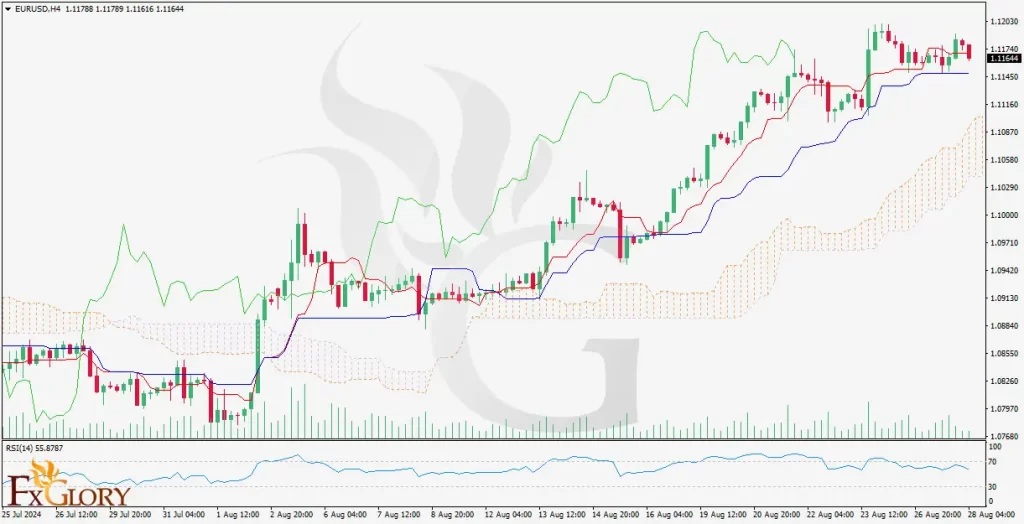
On the H4 timeframe, the EUR/USD pair has experienced a notable bullish wave, driving the price higher towards key resistance levels. Recent price action suggests that this bullish momentum may be waning, as indicated by candlestick patterns that show indecision or possible reversal near these resistance levels. A bearish correction could be on the horizon, particularly if the bullish momentum fails to break through the established resistance.
Key Technical Indicators:
Ichimoku Cloud: The Ichimoku Cloud analysis shows that Tenkan-sen (blue line) is about to cross below Kijun-sen (red line), a bearish signal suggesting potential trend reversal. The price has been trading above the cloud, indicating an uptrend, but the potential Tenkan-Kijun crossover is a warning of a shift in momentum.
Relative Strength Index (RSI): The RSI is showing a negative divergence, where the price makes higher highs, but the RSI fails to confirm those highs, indicating weakening bullish momentum. Currently, RSI is at 55.8787, which is in the neutral zone but leaning towards overbought conditions.
Volume Analysis: The volume has not significantly supported the recent bullish wave, implying that the upward momentum might lack the strength to sustain a further rally. Lower volume during price increases often indicates potential exhaustion of buying interest.
Support and Resistance:
Resistance: The nearest resistance level is at 1.1187, which is a recent high and could serve as a barrier for further upward movement. A break above this level could signal the continuation of the bullish trend.
Support: Key support levels to monitor include 1.1100, near the base of the Ichimoku cloud, and further below at 1.0975, where a significant Fibonacci retracement level lies.
Conclusion and Consideration:
The EUR/USD pair on the H4 chart is showing signs of a potential bearish correction following a strong bullish wave. Negative divergence in the RSI, a potential bearish Tenkan-sen and Kijun-sen crossover in the Ichimoku Cloud, and low volume support suggest that the bullish momentum may be fading. Traders should look for confirmation of a reversal through price action around the current resistance level before considering short positions. Profit-taking could be aimed at key support levels like 1.1100 and 1.0975, using tight stop-losses to manage risk effectively.
Disclaimer: The provided analysis is for informational purposes only and does not constitute investment advice. Traders should conduct their own research and analysis before making any trading decisions.