Time Zone: GMT +3
Time Frame: 4 Hours (H4)
Fundamental Analysis:
The upcoming economic data releases from both the US and Japan are set to influence the USD/JPY pair’s direction prediction. In the US, key indicators such as the S&P/CS Composite-20 HPI y/y, HPI m/m, CB Consumer Confidence, and Richmond Manufacturing Index will be released. The S&P/CS Composite-20 HPI y/y is expected to show a slight decrease from 6.8% to 6.2%, indicating a cooling in the housing market. Meanwhile, the CB Consumer Confidence index is expected to rise to 100.9 from a previous 100.3, suggesting improved consumer sentiment. The Richmond Manufacturing Index is projected to show an improvement from -17 to -14, which still indicates contraction but at a slower pace. These mixed data points could create a volatile trading environment for the USD.
On the Japanese side, the Services Producer Price Index (SPPI) y/y is forecasted to slightly decrease from 3.0% to 2.9%, signaling a potential slowdown in price pressures; which stands as an important forecast element for this fore pair. The BOJ Core CPI y/y is expected to remain stable at 2.1%, suggesting persistent inflation concerns within Japan. The stable inflation rate and the recent dovish stance of the Bank of Japan could continue to exert downward pressure on the JPY.
Price Action:
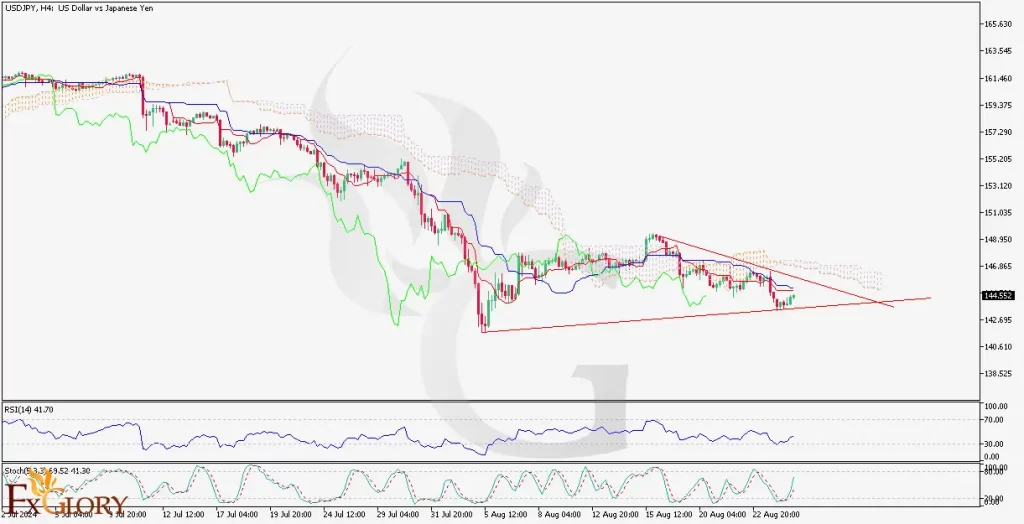
The USD/JPY pair is forming a bearish flag pattern on the H4 chart after a significant bearish wave, which suggests a potential continuation of the downward trend. The price is currently consolidating within this pattern, and a breakout to the downside could accelerate the bearish momentum. However, the presence of bullish technical indicators points to a possible short-term corrective wave.
Key Technical Indicators:
RSI (Relative Strength Index): The RSI is currently at 41.70, indicating bearish sentiment, yet it is not in the oversold territory, suggesting room for further downside before a reversal might occur.
MACD (Moving Average Convergence Divergence): The Stochastic is approaching the 70 level, indicating potential for a bullish wave in the short term if it crosses above this threshold. This could signal a temporary upward correction within the broader bearish trend.
Support and Resistance:
Support Levels: The nearest support is at the lower trendline of the bearish flag pattern, around 144.00. A break below this level could see the pair testing the next support near 142.50, which aligns with previous lows.
Resistance Levels: Immediate resistance is at the upper trendline of the bearish flag, around 145.00. A break above this level could target the next resistance at 146.50, potentially invalidating the bearish flag pattern and signaling a bullish reversal.
Conclusion and Consideration:
The USD/JPY H4 chart suggests that the pair is consolidating within a bearish flag pattern, with potential for further downside if key support levels are breached. Traders should closely monitor the upcoming economic data releases from both the US and Japan, as these could provide the catalyst for the next major move. Given the mixed signals from technical indicators and fundamental outlook, traders should be prepared for both bearish and short-term bullish scenarios, adapting their strategies accordingly to the evolving market conditions.
Disclaimer: The provided analysis is for informational purposes only and does not constitute investment advice. Traders should conduct their own research and analysis before making any trading decisions.