
USDCAD Forecast

USD iconCAD icon
USD/CAD

US Dollar vs Canadian Dollar

USD/CAD Live Price

1.39741
+0.26%

USD/CAD Forecast — 12 September 2026

Time Zone: GMT +3

Time Frame: Daily (D1) / Weekly Outlook

Weekly Fundamental Overview:

The USD/CAD pair faces potential volatility driven by critical economic updates from both Canada and the United States. Canadian inflation data, including various CPI metrics, will offer insight into the Bank of Canada’s monetary policy trajectory. Meanwhile, major US indicators such as retail sales data and the upcoming FOMC rate decision, policy statement, and press conference are expected to influence US Dollar sentiment and overall market direction.

Price Action:

On the daily D1 chart, USD/CAD recently closed at 1.3831, consolidating after a brief bounce from lower levels near 1.37817. Price action reflects a neutral stance, balancing between recent swing lows and overhead supply areas.

Key Technical Indicators:

Bollinger Bands: The daily Bollinger Bands show a middle band at 1.383753, placing the latest close of 1.3831 right near the center of the indicator. The lower band is situated at 1.375915, while the upper band rests at 1.391591, defining the current short-term range.

RSI: The 14-period Relative Strength Index (RSI) stands at 44.78, remaining in neutral territory below the 50 midpoint and indicating moderate underlying market momentum.

MACD: The MACD indicator registers a reading of -0.004167, maintaining a negative value that highlights ongoing mild bearish momentum, though histogram bars suggest steady consolidation.

Support and Resistance:

Key technical levels for USD/CAD include strong support at 1.37302 and major resistance at 1.42463 based on recent daily swing levels.

News to Watch for USDCAD This Week:

  • Trimmed CPI y/y: Updates on underlying Canadian core inflation could impact Bank of Canada policy expectations.
  • Median CPI y/y: Measures key price trends in Canada that may influence the Canadian Dollar.
  • CPI m/m: Tracks monthly inflation dynamics across Canada affecting monetary policy views.
  • Common CPI y/y: Provides additional perspective on Canadian underlying inflationary pressures.
  • Core Retail Sales m/m: Evaluates US consumer spending trends excluding volatile items to gauge economic strength.
  • Retail Sales m/m: Reflects overall US consumer activity and potential demand conditions.
  • FOMC Economic Projections: Offers updated Federal Reserve expectations for interest rates and economic growth.
  • FOMC Statement: Delivers critical insights into Federal Reserve policy decisions and economic views.
  • Federal Funds Rate: Sets the benchmark US interest rate and directly influences the US Dollar.
  • FOMC Press Conference: Features remarks from Fed leadership clarifying monetary policy direction.

Weekly Outlook and Consideration:

USD/CAD enters the week hovering near its daily Bollinger middle band of 1.383753 with a recent close of 1.3831. Indicators reflect balanced market conditions, as seen in the neutral RSI of 44.78 and a slightly negative MACD of -0.004167. Price action remains bounded between technical support at 1.37302 and resistance at 1.42463. Upcoming high-impact releases, particularly Canadian CPI readings and the FOMC policy announcement, are likely to dictate the pair’s next directional movement.

Disclaimer: The analysis provided for USD/CAD is for informational purposes only and does not constitute investment advice. Traders are encouraged to perform their own analysis and research before making any trading decisions. Market conditions can change quickly, so staying informed with the latest data is essential.
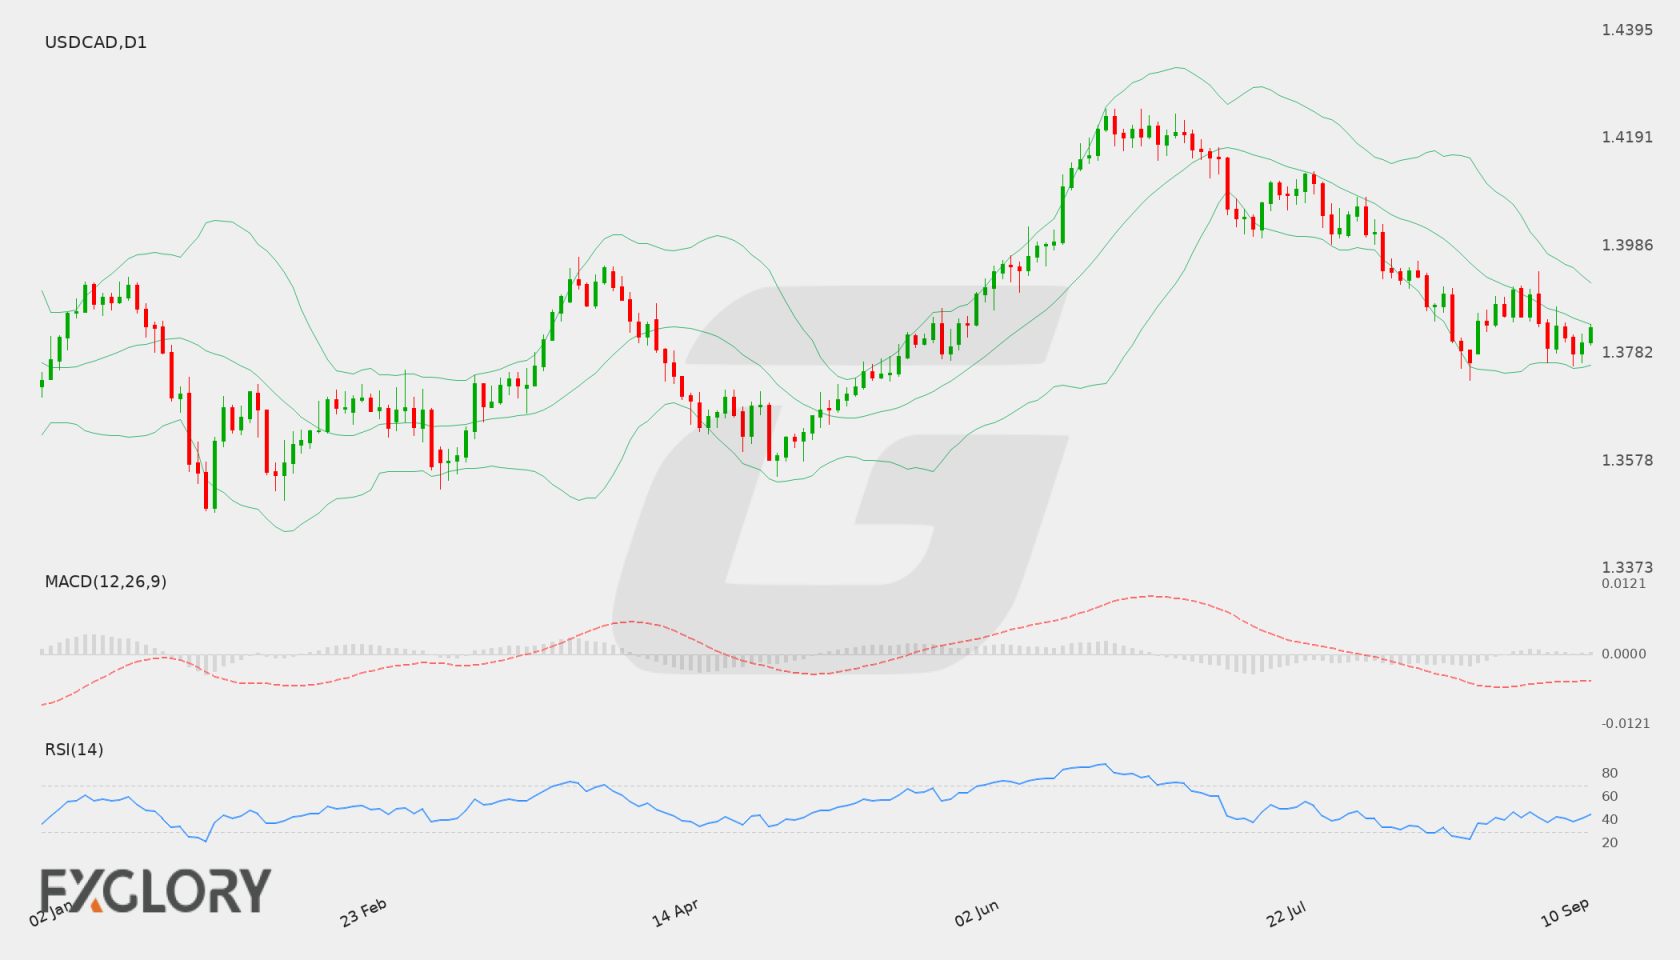
USD/CAD D1 technical analysis chart
USD/CAD D1 Technical Analysis for 09.12.2026

USD/CAD Forecast — 1 September 2026

Time Zone: GMT +3

Time Frame: Daily (D1) / Weekly Outlook

Weekly Fundamental Overview:

The USD/CAD currency pair reflects ongoing macroeconomic dynamics between the United States dollar and the Canadian dollar. Fundamental conditions remain influenced by economic growth signals, central bank policy expectations, and broader market risk sentiment affecting both currencies.

Price Action:

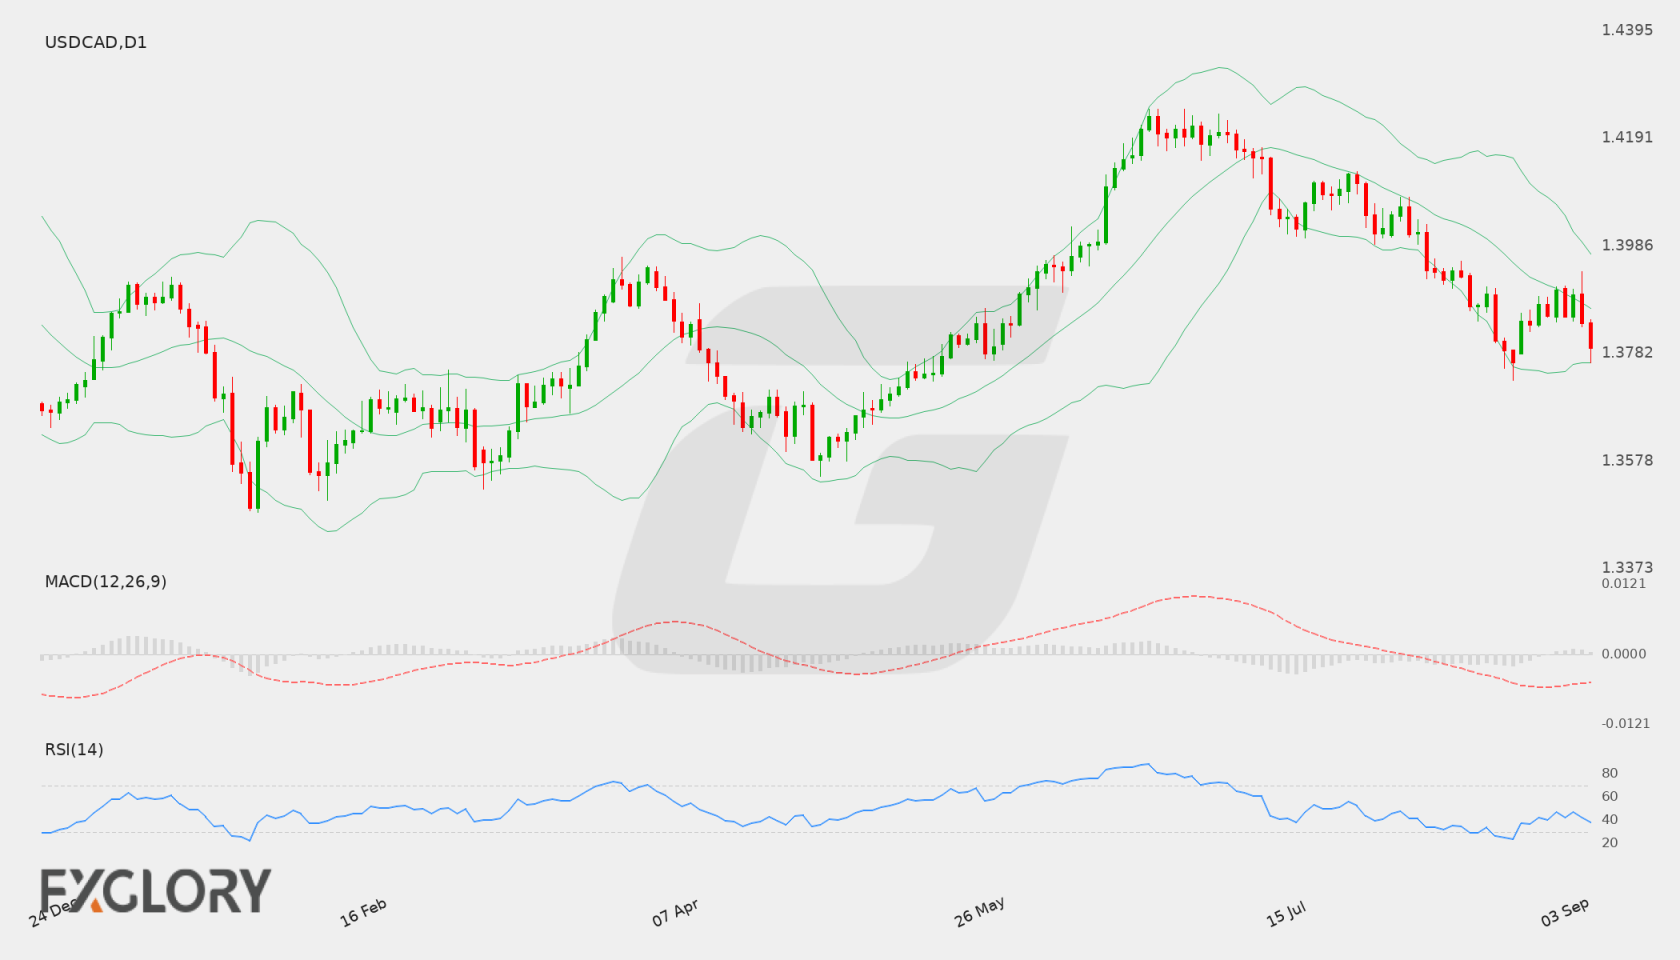
On the daily (D1) chart, USD/CAD recently closed at 1.38518 after dropping from a high of 1.39104 in the latest candle session. Price action indicates short-term downward momentum as the instrument trades beneath its mid-band average level.

Key Technical Indicators:

Bollinger Bands: The daily Bollinger Bands feature a middle line at 1.38956, an upper band at 1.40432, and a lower band at 1.37479. With USD/CAD closing at 1.38518, price action is currently situated in the lower channel between the middle and lower bands.

RSI: The 14-day Relative Strength Index (RSI) stands at 41.74, reflecting moderate bearish momentum while staying above the oversold threshold.

MACD: The daily MACD indicator registers a reading of -0.00484. The negative MACD value indicates prevailing downward momentum in the daily timeframe for the pair.

Support and Resistance:

Key technical levels on the daily chart show main support positioned at 1.37302, with overhead technical resistance established at 1.42463.

News to Watch for USDCAD This Week:

  • ISM Services PMI: This release provides key economic insight into services sector activity that can influence US dollar performance.

Weekly Outlook and Consideration:

The weekly technical outlook for USD/CAD remains neutral-to-bearish based on the D1 analysis. Trading at 1.38518 beneath the middle Bollinger Band at 1.38956 aligns with negative momentum from the MACD (-0.00484) and a sub-50 RSI of 41.74. Continued downside pressure could bring price action toward the key support level at 1.37302, whereas a bullish reversal would face initial resistance toward 1.42463.

Disclaimer: The analysis provided for USD/CAD is for informational purposes only and does not constitute investment advice. Traders are encouraged to perform their own analysis and research before making any trading decisions. Market conditions can change quickly, so staying informed with the latest data is essential.
USD/CAD Forecast — 5 September 2026

Time Zone: GMT +3

Time Frame: Daily (D1) / Weekly Outlook

Weekly Fundamental Overview:

Market sentiment for USD/CAD (USDCAD) continues to be shaped by upcoming economic releases and broader fiscal announcements. Investors and traders are closely evaluating consumer and producer price trends alongside employment metrics to anticipate future central bank policy adjustments.

Price Action:

On the Daily (D1) timeframe, USD/CAD (USDCAD) recorded a recent close at 1.37923. The price action reflects a downward push over recent sessions, bringing the pair closer to its key daily support zone while remaining well below recent high swing levels.

Key Technical Indicators:

Bollinger Bands: The Bollinger Bands indicator highlights a middle band at 1.38678, an upper band at 1.39715, and a lower band at 1.37641. USD/CAD is trading near the lower band and below the middle moving average line, pointing to persistent selling pressure in the current setup.

RSI: The 14-day Relative Strength Index (RSI) stands at 37.75. This value places the pair in weaker territory below the 50 neutral mark, approaching oversold conditions without showing an immediate reversal signal.

MACD: The MACD indicator is currently reading -0.00452, lingering below the zero line. This negative territory signals sustained bearish momentum across daily price action for USD/CAD.

Support and Resistance:

For USD/CAD (USDCAD), immediate daily technical support is identified at 1.37302, while major resistance stands overhead at 1.42463.

News to Watch for USDCAD This Week:

  • Annual Budget Release: Updates on government fiscal projections can influence overall economic sentiment and local currency demand.
  • PPI m/m: Wholesale price shifts offer early signals regarding broader inflationary trends in the supply chain.
  • Core PPI m/m: Stripping out volatile factors provides a clearer view of underlying producer price trends.
  • Unemployment Claims: Weekly employment trends provide insight into labor market strength and economic activity.
  • Core CPI m/m: Essential indicator for measuring core consumer price shifts without food and energy influences.
  • CPI y/y: Annual consumer inflation metrics heavily impact central bank rate expectations.
  • Core CPI y/y: Reflects long-term consumer inflation stability and dictates broader monetary policy outlooks.
  • CPI m/m: Monthly price changes signal short-term shifts in inflation trends.
  • Prelim UoM Inflation Expectations: Consumer expectations offer perspective on future economic behavior and price pressures.

Weekly Outlook and Consideration:

USD/CAD (USDCAD) enters the session with a bearish tilt as daily indicators remain subdued. With price hovering around 1.37923, market participants will be observing how price interacts near support at 1.37302 and the lower Bollinger Band at 1.37641. A firm hold around support could allow for a consolidation phase, while an extension of the decline keeps attention on lower levels. Conversely, any rebound will face dynamic resistance near the 1.38678 middle band before approaching major resistance at 1.42463.

Disclaimer: The analysis provided for USD/CAD is for informational purposes only and does not constitute investment advice. Traders are encouraged to perform their own analysis and research before making any trading decisions. Market conditions can change quickly, so staying informed with the latest data is essential.

USD/CAD D1 technical analysis chart
USD/CAD D1 Technical Analysis for 09.05.2026

USD/CAD Forecast — 14 September 2026

Time Zone: GMT +3

Time Frame: Daily (D1) / Weekly Outlook

Weekly Fundamental Overview:

The USD/CAD currency pair continues to be driven by broader market risk sentiment and upcoming macroeconomic data from the United States. Dynamics in commodity markets and central bank policy expectations also remain key drivers for the exchange rate.

Price Action:

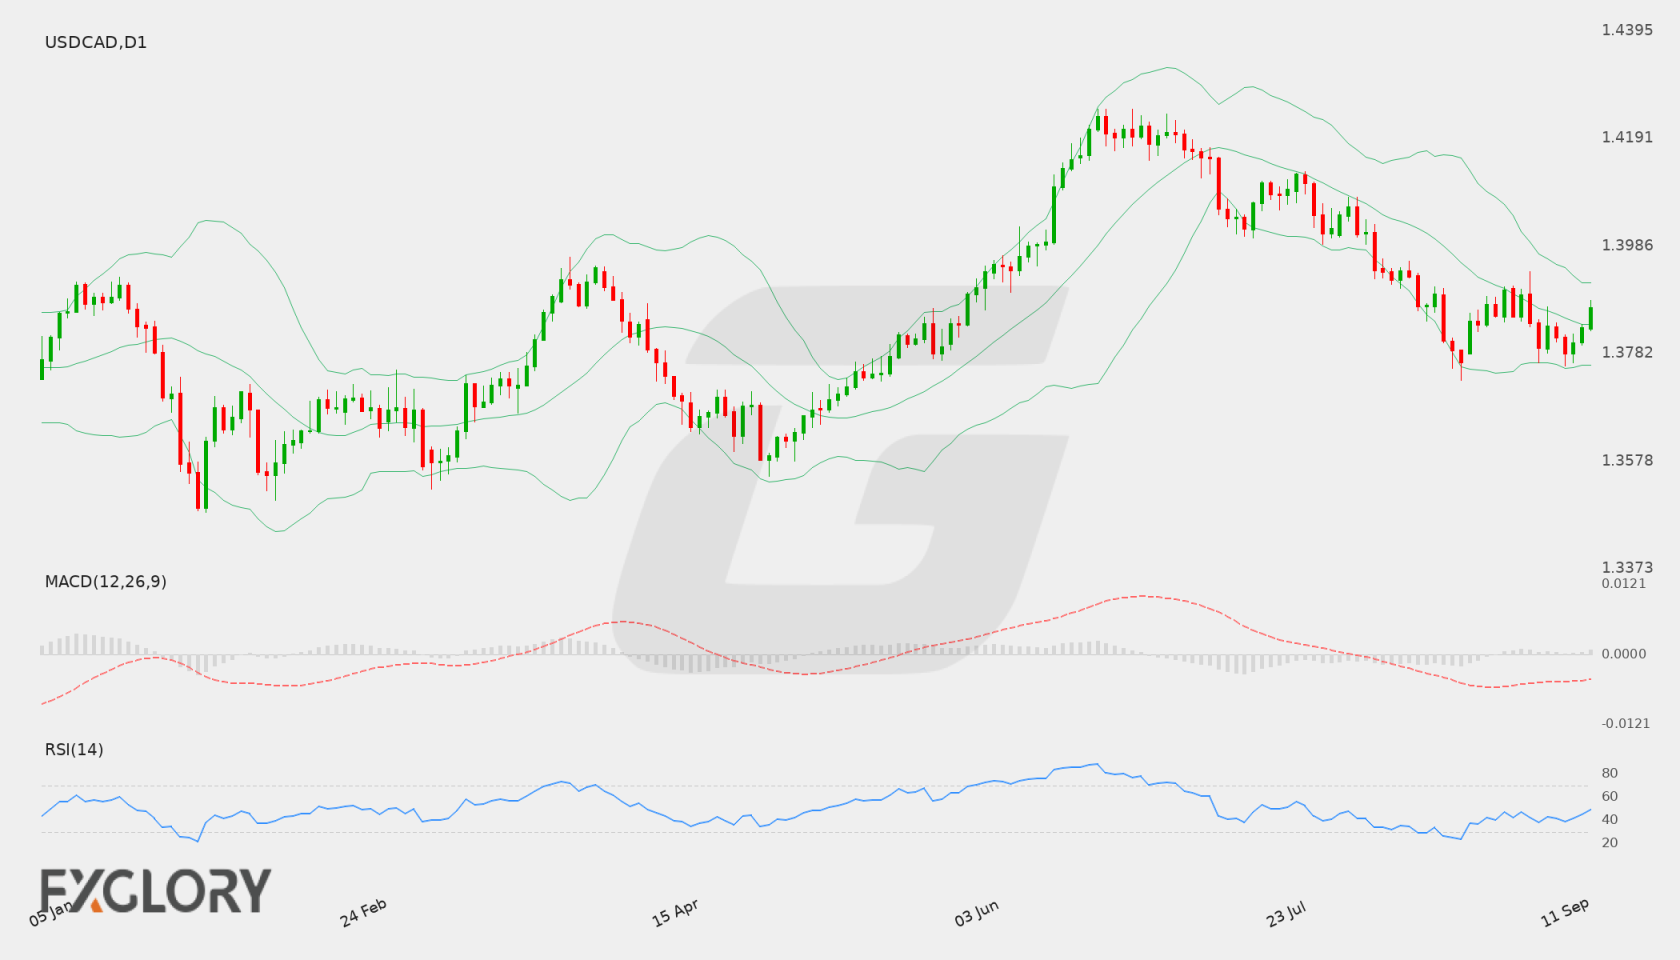
On the daily (D1) chart, USD/CAD recently rebounded from a low around 1.37817 up to a close of 1.38690. The recent sequence of daily candles shows a move back above the middle line of the Bollinger Bands, reflecting short-term bullish momentum within the recent trading range.

Key Technical Indicators:

Bollinger Bands: The Bollinger Bands indicate a middle band at 1.38374, an upper band at 1.39155, and a lower band at 1.37592. Trading at 1.38690, the pair sits between the middle and upper bands, pointing to moderate upward pressure.

RSI: The 14-day Relative Strength Index (RSI) is positioned at 49.26. This neutral reading reflects a balanced market without clear overbought or oversold conditions.

MACD: The D1 MACD indicator stands at -0.00356. Being below the zero line, it suggests that longer-term momentum still carries a mild bearish tone despite the recent price bounce.

Support and Resistance:

Key technical levels include primary support at 1.37302 and main resistance at 1.42463. Nearer dynamic barriers are defined by the lower Bollinger Band at 1.37592 and the upper Bollinger Band at 1.39155.

News to Watch for USDCAD This Week:

  • Unemployment Claims: Tracks weekly initial jobless claims to evaluate the health of the labor market.
  • Revised UoM Inflation Expectations: Assesses consumer views on prospective price changes and inflation trends.
  • Revised UoM Consumer Sentiment: Measures consumer confidence regarding overall economic performance and personal finances.

Weekly Outlook and Consideration:

USD/CAD traded up to close at 1.38690, placing it above the middle Bollinger Band at 1.38374. With a neutral D1 RSI of 49.26 and a negative MACD of -0.00356, technical indicators provide mixed signals. Continued strength could see price move toward the upper Bollinger Band at 1.39155 and resistance at 1.42463, whereas a downward shift could retest lower Bollinger support at 1.37592 and main support at 1.37302.

Disclaimer: The analysis provided for USD/CAD is for informational purposes only and does not constitute investment advice. Traders are encouraged to perform their own analysis and research before making any trading decisions. Market conditions can change quickly, so staying informed with the latest data is essential.

USD/CAD D1 technical analysis chart
USD/CAD D1 Technical Analysis for 09.14.2026

USD/CAD Forecast — 22 August 2026

Time Zone: GMT +3

Time Frame: Daily (D1) / Weekly Outlook

Weekly Fundamental Overview:

USD/CAD faces heightened market focus as traders evaluate economic trajectory and policy expectations for both the US Dollar and Canadian Dollar. Key upcoming macroeconomic releases are expected to shape currency valuation and overall sentiment across the pair.

Price Action:

On the daily D1 chart, USD/CAD has extended a clear downward trajectory, dropping from levels near 1.4200 to a recent close of 1.37878. The series of lower daily closes reflects sustained selling interest, positioning price action near key lower thresholds.

Key Technical Indicators:

Bollinger Bands: The D1 Bollinger Bands indicate a middle line at 1.39713, an upper band at 1.41585, and a lower band at 1.37841. With the current close at 1.37878 resting almost directly on the lower band, price action is testing lower volatility boundary limits.

RSI: The 14-day Relative Strength Index (RSI) is currently reading 24.99. Staying well below the 30 level, the oscillator signals that the instrument is in oversold territory, which may indicate potential for temporary consolidation or corrective pullbacks.

MACD: The MACD indicator on the daily chart stands at -0.006415, staying below the zero line. This negative reading indicates ongoing downward momentum for USD/CAD as sellers maintain control of the prevailing trend.

Support and Resistance:

Key technical support is established at 1.37538, representing a major level near recent daily lows. On the upside, main resistance sits at 1.42463, while the middle Bollinger Band at 1.39713 serves as intermediate dynamic resistance.

News to Watch for USDCAD This Week:

  • CB Consumer Confidence: Gauges consumer economic outlook and can affect overall USD sentiment.
  • Core PCE Price Index m/m: Serves as a primary inflation gauge that influences central bank policy expectations.
  • Prelim GDP q/q: Reflects underlying economic growth trends and impacts market view on dollar strength.
  • Prelim GDP Price Index q/q: Indicates broader price pressures across economic output.
  • Unemployment Claims: Provides timely updates on labor market health and economic resilience.
  • GDP m/m: Highlights monthly Canadian economic performance and impacts CAD demand.
  • Prelim Benchmark Payrolls Revision: Reveals significant updates to employment statistics that can shift rate forecasts.

Weekly Outlook and Consideration:

USD/CAD approaches the new trading session in a strong downside trend, closing at 1.37878 near its daily lower Bollinger Band of 1.37841. A negative MACD at -0.006415 reinforces bearish price momentum, though an RSI of 24.99 points to heavily oversold conditions. A sustained breakdown below support at 1.37538 could open space for further declines, whereas holding above this floor may invite a temporary bounce toward upper resistance levels up to 1.42463 amid significant economic news releases.

Disclaimer: The analysis provided for USD/CAD is for informational purposes only and does not constitute investment advice. Traders are encouraged to perform their own analysis and research before making any trading decisions. Market conditions can change quickly, so staying informed with the latest data is essential.

1USD = –––CAD –––%
USDCAD
Loading chart...