Time Zone: GMT +3
Time Frame: 4 Hours (H4)
Fundamental Analysis:
The GBP/USD news analysis today is currently influenced by several key economic indicators. For today, the focus is on the U.S. data releases, including Jobless Claims and PMI figures, which will provide insights into the U.S. economy’s health. Stronger-than-expected data could bolster the U.S. Dollar, leading to potential changes in the GBP/USD exchange rate. On the other hand, the U.K.’s PMI data and CBI Industrial Trends Survey are essential for gauging the British economy’s performance. Better-than-expected U.K. data could support the Pound, but overall for this pair that is also known as the “Cable”, its market sentiment will largely be driven by U.S. economic indicators due to their global impact.
Price Action:
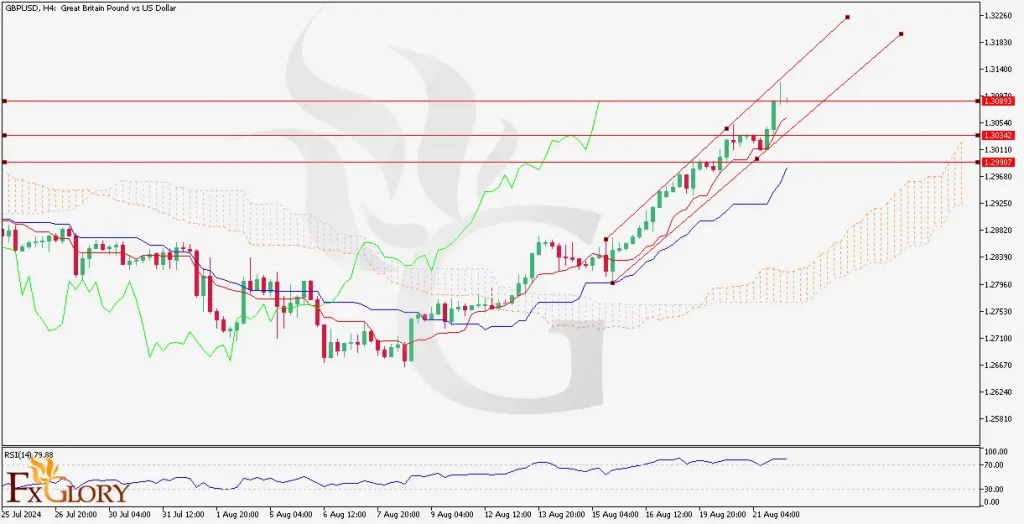
The GBP/USD H4chart, depicts the pair in a clear uptrend, with the price moving within an ascending channel. The recent candles show the Cable’s strong bullish momentum, with the price making higher highs and higher lows. The pair’s price action suggests that the pair is likely to continue its upward trajectory, although the price is currently approaching significant resistance levels that could lead to a temporary pullback or consolidation.
Key Technical Indicators:
Ichimoku Cloud: The price is well above the Ichimoku Cloud, which is a strong bullish signal. The Tenkan-sen (blue) and Kijun-sen (red) lines are in a bullish crossover, further supporting the upward momentum. The Chikou Span (green) is also positioned above the price, confirming the bullish trend.
RSI (Relative Strength Index): The RSI is currently around 79.88, indicating that the pair is in overbought territory. While this suggests that the bullish momentum is strong, it also warns of a possible correction or consolidation in the near term as the market may need to cool off.
Support and Resistance:
Support Levels: Immediate support is located at 1.3034, followed by stronger support at 1.2939, which coincides with the lower boundary of the Ichimoku Cloud.
Resistance Levels: The pair is currently testing resistance at 1.3089, with the next significant resistance level around 1.3140.
Conclusion and Consideration:
The GBP/USD technical analysis today shows a strong bullish trend, supported by the Ichimoku Cloud and the ascending channel formation. However, the RSI indicates that the pair is overbought, suggesting that a correction could be imminent. Traders should consider the upcoming U.S. economic data releases, which could influence the pair’s forecast today. A break above 1.3089 could lead to further gains, but caution is advised due to the overbought RSI. Proper risk management, including setting stop-losses below the lower channel boundary, is recommended to protect against potential market volatility.
Disclaimer: The provided analysis is for informational purposes only and does not constitute investment advice. Traders should conduct their own research and analysis before making any trading decisions.