Time Zone: GMT +3
Time Frame: 4 Hours (H4)
Fundamental Analysis:
The EUR/USD pair, reflecting the exchange rate between the Euro and the US Dollar, is currently influenced by recent economic data releases from both the Eurozone and the United States. In the Eurozone, the latest PMI readings suggest a mixed economic outlook. The French Manufacturing PMI slightly improved to 44.4 from 44.0, indicating a marginal recovery, although the sector remains in contraction. The French Services PMI edged up to 50.2 from 50.1, pointing to stability in the services sector. Similarly, Germany’s Manufacturing PMI, while still weak at 43.4, showed a minor improvement from 43.2, whereas the Services PMI dipped slightly to 52.3 from 52.5, reflecting a slight slowdown. Meanwhile, in the United States, a significant drawdown in Crude Oil Inventories by -2.0M barrels, against expectations of a 1.4M increase, could signal potential supply constraints, influencing inflation expectations. Additionally, the upcoming FOMC Meeting Minutes will be crucial, as they are likely to offer insights into the Federal Reserve’s stance on future interest rates, a key driver of the USD’s strength or weakness. These mixed economic signals suggest a cautious outlook for the EUR/USD pair, with the potential for heightened volatility depending on further developments in economic data and central bank policies.
Price Action:
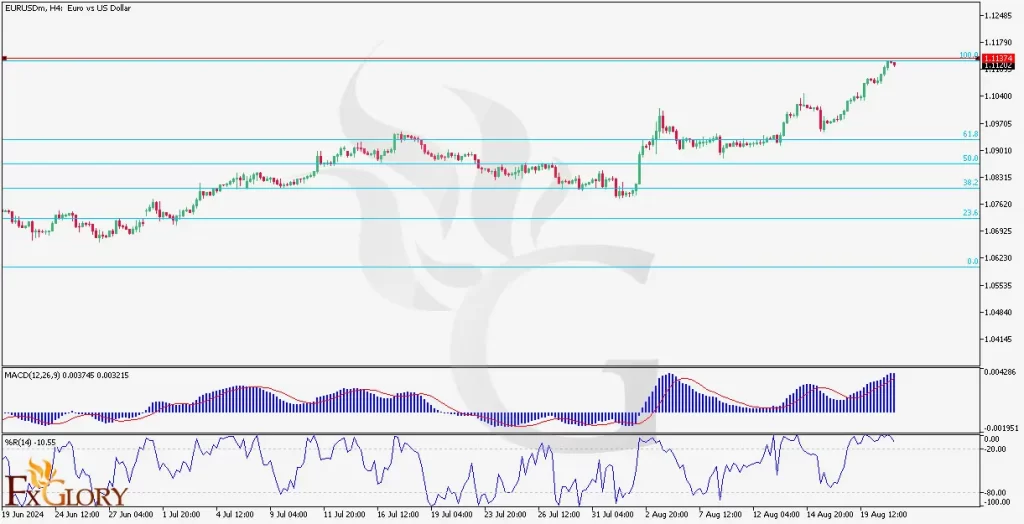
On the H4 timeframe, the EUR/USD pair has experienced a robust bullish wave, propelling the price towards a significant resistance level. The recent price action has shown the formation of candlestick patterns at this resistance, indicating that the bullish momentum may be losing strength. This setup raises the possibility of a bearish correction, particularly as the price approaches this critical resistance. The technical indicators also reinforce this outlook. The MACD indicator is displaying signs of negative divergence, with the MACD line remaining below the signal line despite recent price highs, suggesting that the bullish momentum could be weakening. Similarly, the Williams %R is signaling overbought conditions, hovering near the -10 level, which typically precedes a market pullback.
Key Technical Indicators:
MACD (Moving Average Convergence Divergence): The MACD indicator is showing signs of a negative divergence, where the MACD line remains below the signal line despite the recent price highs. This divergence could indicate weakening bullish momentum and the potential for a bearish correction.
Williams %R (Percent Range): The Williams %R is also indicating overbought conditions, hovering near the -10 level, suggesting that the market might be due for a pullback.
Support and Resistance:
Support Levels: Potential support levels to watch for a bearish correction include the 61.8% Fibonacci retracement at 1.0975, the 50% retracement at 1.0901, and the 38.2% retracement at 1.0831.
Resistance Levels: The nearest resistance is at 1.1187, which corresponds with the current high and the 100% Fibonacci extension level.
Conclusion and Consideration:
The EUR/USD pair on the H4 chart is at a critical juncture, with potential for a bearish correction after a significant bullish wave. The negative divergence in the MACD and the overbought signal from the Williams %R suggest that a pullback could be imminent. Traders should consider short positions if the price action confirms a reversal at the current resistance level, targeting the key Fibonacci retracement levels as potential profit zones.
Disclaimer: The EURUSD provided analysis is for informational purposes only and does not constitute investment advice. Traders should conduct their own research and analysis before making any trading decisions. Market conditions can change rapidly, and it is essential to stay updated with the latest information. Always consider risk management strategies and consult with a financial advisor if necessary.