Time Zone: GMT +3
Time Frame: 4 Hours (H4)
Fundamental Analysis:
The EUR/CAD forecast today is shaped by a series of critical economic indicators from both the Eurozone and Canada, creating a dynamic environment for potential market movements. From the Eurozone, the Current Account surplus came in at €37.0B, slightly higher than the previous €36.7B, indicating a stable economic backdrop. The Final Core CPI and Final CPI both remained steady at 2.9% and 2.6% y/y, respectively, showing no major inflationary surprises. On the Canadian side, the focus is on the upcoming CPI data, with expectations for a slight uptick in inflation pressures. The monthly CPI is forecasted to rise by 0.4% following a previous decline of -0.1%. Median, Trimmed, and Common CPI readings are also expected to show minor decreases, hinting at a potentially mixed inflation scenario. These economic releases are likely to have a significant impact on the EUR/CAD trading strategy, as traders assess the relative strength of the Eurozone and Canadian economies.
Price Action:
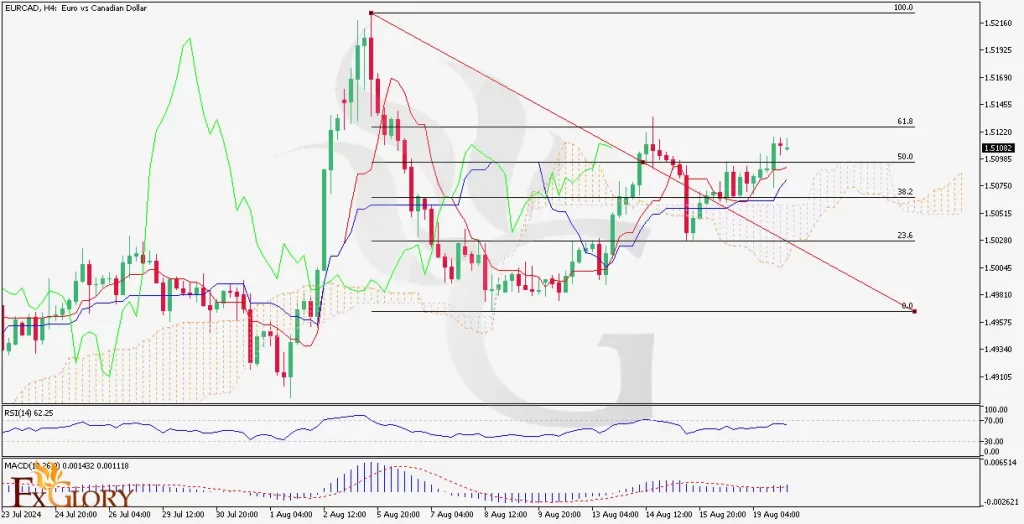
The EUR/CAD pair is currently testing a crucial resistance level on the H4 chart, with recent price action suggesting a potential bearish reversal. The price is showing signs of stalling at this resistance, which aligns with the 50.0% and 38.2% Fibonacci retracement levels of the previous bearish wave. This confluence of resistance levels could trigger a bearish move if the pair fails to break higher, making this a critical juncture for traders to watch closely.
Key Technical Indicators:
MACD (Moving Average Convergence Divergence):The MACD is also showing potential for a bearish wave, with the histogram indicating a possible decline in bullish momentum. If this bearish crossover materializes, it could further confirm the likelihood of a downward move in EUR/CAD.
RSI (Relative Strength Index): The RSI is currently touching a dynamic bearish trend line, which could act as a resistance and trigger a downward move. This aligns with the overall bearish sentiment seen in the price action, suggesting that the recent uptrend may be losing steam.
Support and Resistance:
Support Levels: The nearest support is located at the 50.0% Fibonacci retracement level, around 1.50800, with additional support at the 38.2% level, near 1.50600. These levels are critical to monitor, as a break below them could accelerate the bearish momentum.
Resistance Levels: The current resistance is at 1.51100, with a stronger resistance at the recent high of 1.51450. A successful breach of these levels could invalidate the bearish outlook and lead to further gains.
Conclusion and Consideration:
The EUR/CAD H4 chart suggests that the pair is at a pivotal resistance level, with potential for a bearish reversal driven by both technical indicators and upcoming economic data releases. Traders should remain alert to the unfolding economic news from Canada, particularly the CPI figures, which could significantly influence market sentiment and the pair’s direction. Adapting trading strategies to these developments will be key for effectively navigating the EUR/CAD market in the short term.
Disclaimer: The provided analysis is for informational purposes only and does not constitute investment advice. Traders should conduct their own research and analysis before making any trading decisions.