Time Zone: GMT +3
Time Frame: 4 Hours (H4)
Fundamental Analysis:
The GBPCAD currency pair represents the exchange rate between the British Pound (GBP) and the Canadian Dollar (CAD). Today, the GBP might experience fluctuations due to upcoming economic data releases, such as the UK’s retail sales figures, which can provide insight into consumer spending and economic health. Meanwhile, the CAD is likely to be influenced by the release of Canadian inflation data, which will be closely monitored for any indications of future monetary policy adjustments by the Bank of Canada. Additionally, oil prices, a critical factor for the CAD, remain volatile, potentially affecting the CAD’s strength against the GBP.
Price Action:
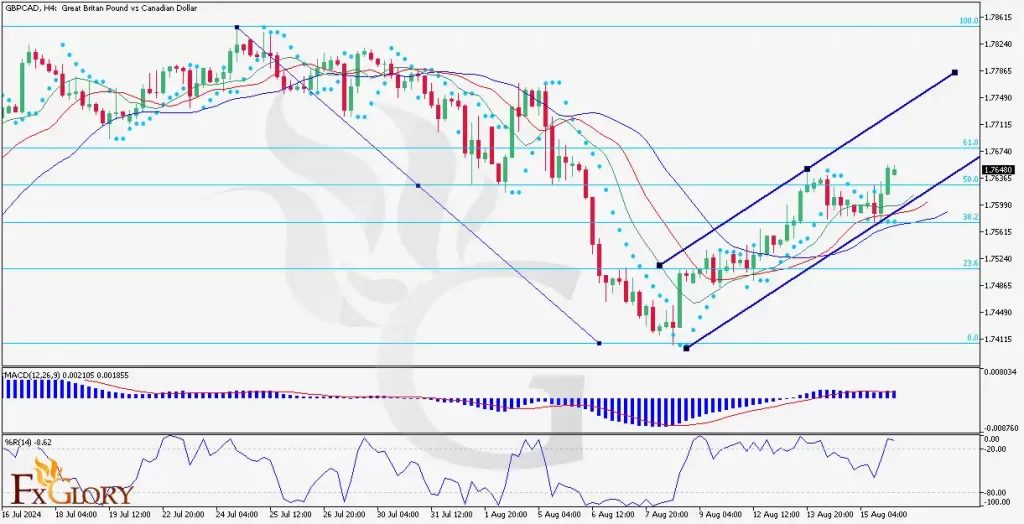
In the H4 timeframe, the GBP/CAD has exhibited a bullish trend over the past week. The price has been moving within an ascending channel, as indicated by the clear higher highs and higher lows formation. The last three candles have been bullish, with the most recent candle closing near a key resistance level, suggesting strong buying momentum. However, the price is nearing the upper boundary of the ascending channel, which may act as a resistance zone, potentially leading to a consolidation phase or a minor pullback.
Key Technical Indicators:
Parabolic SAR (0.2): The Parabolic SAR indicator shows a bullish trend, with the last three dots placed below the candlesticks. This positioning of the Parabolic SAR below the price indicates continued upward momentum. The recent bullish candles reinforce the likelihood of further gains in the short term unless a reversal signal emerges.
Alligator Indicator: The Alligator indicator is currently bullish, with the green lips line (fastest moving average) crossing above the red teeth line (medium moving average) and the red teeth line positioned above the blue jaws line (slowest moving average). This alignment of the Alligator’s lines indicates that the upward trend is strengthening, with the GBPCAD price likely to continue its bullish movement in the near term.
MACD (Moving Average Convergence Divergence): The MACD is in bullish territory, with the MACD line above the signal line. The histogram bars are positive, indicating that the bullish momentum is gaining strength. The widening gap between the MACD and the signal line suggests an acceleration in the upward trend, although traders should watch for any signs of divergence that could indicate a potential trend reversal.
%R (14): The Williams %R is currently around -8.62, indicating that the GBP CAD pair is in overbought territory. While this suggests that the bullish trend is strong, it also signals a potential for a short-term correction as the market may be overstretched. Traders should be cautious of a possible pullback or consolidation in the coming sessions.
Support and Resistance:
Support: Immediate support is located at 1.75615, which aligns with the 38.2% Fibonacci retracement level and the lower boundary of the ascending channel. This level has acted as a strong support in the past and could provide a base for further upward movement if the price tests this area.
Resistance: The nearest resistance level is at 1.76740, which corresponds to the 61.8% Fibonacci retracement level and the upper boundary of the ascending channel. A break above this level could open the door for further gains, potentially targeting the next resistance around 1.77500.
Conclusion and Consideration:
The GBP/CAD forex pair on the H4 chart shows strong bullish momentum supported by the Parabolic SAR, Alligator, MACD, and %R indicators. The current price action within the ascending channel indicates that the bulls remain in control. However, with the %R in overbought territory, there could be a risk of a short-term pullback or consolidation. Traders should be cautious around the 61.8% Fibonacci resistance level and consider any potential retracements as opportunities to re-enter the bullish trend.
Disclaimer: This GBPCAD technical and fundamental analysis is intended for informational purposes only and does not constitute investment advice. Market conditions can change rapidly, and it is essential to conduct your own analysis and stay updated with the latest information before making any trading decisions.


