Time Zone: GMT +3
Time Frame: 4 Hours (H4)
Fundamental Analysis:
The AUD/USD news analysis today is influenced by several key fundamental factors, these economic data are released from both Australia and the United States, most of the time leading to increased volatility in the pair commonly known as the “Aussie”. Australia’s economic health, particularly in areas such as employment, inflation, and consumer spending, plays a crucial role in determining the strength of the Australian Dollar. On the other hand, the US Dollar is affected by economic indicators like retail sales, jobless claims, and manufacturing indexes. Given the interconnectedness of the global economy, shifts in US monetary policy, particularly interest rate decisions by the Federal Reserve, have a significant impact on the AUD/USD exchange rate. The upcoming economic data for the US, such as retail sales and unemployment claims, are likely to drive the pair’s market sentiment and could affect the Aussie’s forecast.
Price Action:
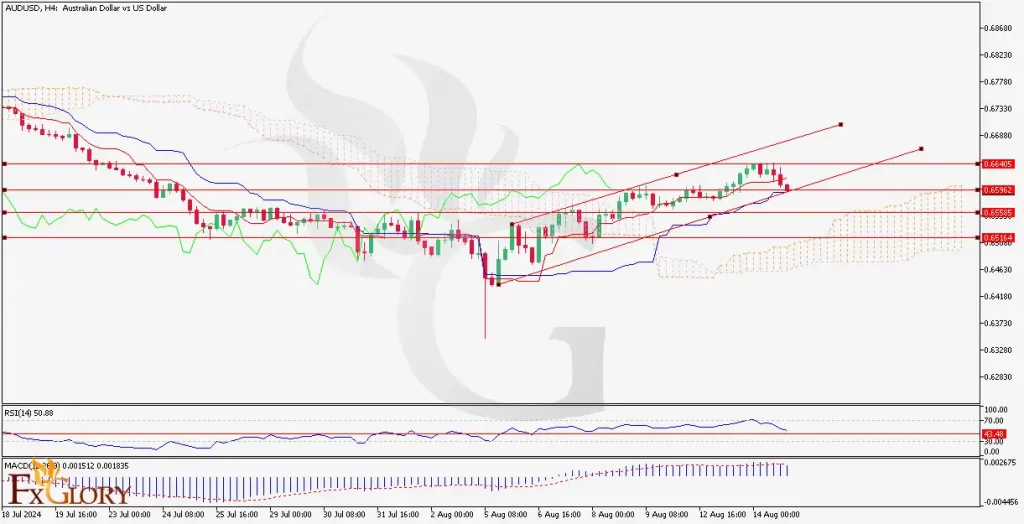
The AUD/USD H4 chart, shows a steady uptrend after a prolonged downtrend, as indicated by the price movements above the Ichimoku Cloud. The pair’s price action suggests that the pair is currently in a consolidation phase, with potential for continued bullish momentum. The price has recently bounced from a key support level and is now trading within a rising channel. The Aussie is facing resistance near the upper boundary of this channel, and a breakout above this level could signal a continuation of the uptrend.
Key Technical Indicators:
Ichimoku Cloud: The AUD/USD price is trending above the Ichimoku Cloud, indicating its bullish market environment. The cloud itself acts as a support zone, and the price’s position above it suggests that the uptrend is still intact. However, the flat Kijun-Sen line might indicate some hesitation or consolidation in the near term.
RSI (Relative Strength Index): The RSI is hovering around 50, which is a neutral zone, suggesting that the market is not overbought or oversold. This level indicates that there is room for further price movement in either direction, but the current consolidation phase might lead to a continuation of the existing trend if the RSI begins to rise.
MACD (Moving Average Convergence Divergence): The MACD line is above the signal line, with a positive histogram, indicating that bullish momentum is still present. The increasing distance between the MACD line and the signal line suggests that the upward movement could continue if the current trend persists.
Support and Resistance:
Support Levels: The first support is located at 0.6596, which is the lower boundary of the rising channel and close to the Ichimoku Cloud. The next significant support level is at 0.6516, aligning with a previous swing low and the bottom of the cloud.
Resistance Levels: Immediate resistance is at 0.6640, which is the upper boundary of the rising channel. A breakout above this level could see the price move towards the next resistance at 0.6680, which coincides with a previous high.
Conclusion and Consideration:
The AUD/USD technical analysis today is showing signs of a potential continuation of the Aussie’s bullish trend, supported by the positive signals from the Ichimoku Cloud, MACD, and the price’s position within the rising channel. The RSI indicates that the market is currently in a neutral state, allowing for further price movement in either direction. Traders should monitor the upcoming US economic data releases, as these could influence the strength of the USD and impact the AUD/USD fundamental outlook. A breakout above the 0.6640 resistance level could signal a continuation of the uptrend, while a drop below the 0.6596 support could indicate a potential reversal or deeper consolidation.
Disclaimer: The provided analysis is for informational purposes only and does not constitute investment advice. Traders should conduct their own research and analysis before making any trading decisions.