Time Zone: GMT +3
Time Frame: 4 Hours (H4)
Fundamental Analysis:
The EUR/USD news analysis today is influenced by a combination of Eurozone and U.S. economic factors. Recently, the U.S. Treasury released its Monthly Treasury Statement, indicating a difference in the federal government’s income and spending, which could potentially impact the U.S. Dollar depending on whether the deficit is larger or smaller than expected. Additionally, the Federal Reserve Bank of Cleveland’s inflation expectations report could sway investor sentiment if the forecast differs significantly from the actual data. On the Euro side, the Wholesale Price Index (WPI) from Destatis, which indicates changes in the price of goods sold by wholesalers, will be a crucial indicator to monitor as it may hint at upcoming consumer inflation trends in the Eurozone. These factors combined suggest that market participants should remain cautious of any news releases that might have an effect on today’s EUR/USD forecast.
Price Action:
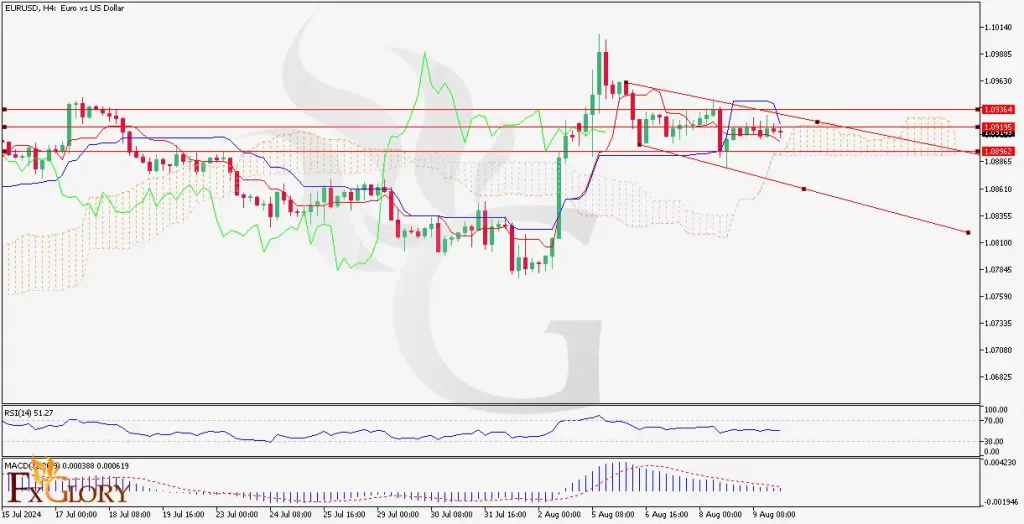
The EUR/USD H4 chart demonstrates a bearish trend for the pair also known as the ‘Fiber’, with the price nearing the Ichimoku Cloud, which it seems poised to break downward. The Fiber’s price action shows consolidation within a descending triangle pattern, indicating a potential continuation of the downtrend if the lower boundary of the pattern is breached. The recent candlesticks suggest indecision, but with a bearish bias, as indicated by the rejection of higher prices and the subsequent movement toward the triangle’s lower trendline.
Key Technical Indicators:
Ichimoku Cloud: The price is currently approaching the lower edge of the Ichimoku Cloud. A break below the cloud would signify a bearish continuation, potentially leading to further downside. The cloud ahead is thin, suggesting weak future support levels.
RSI (Relative Strength Index): The RSI is at 51.27, hovering around the midline, which indicates a neutral stance. However, given the recent price action and the prevailing bearish trend, the RSI might dip further, signaling increasing selling pressure.
Stochastic Oscillator: The MACD histogram shows decreasing momentum, with the MACD line close to crossing below the signal line. This potential bearish crossover could confirm a continuation of the downward trend.
Support and Resistance:
Support Levels: The nearest resistance levels are at 1.09364 and 1.09195, which correspond to previous highs and could act as barriers to any upward movement.
Resistance Levels: The immediate support is at 1.08962. If the price breaks below this level, it may find further support around 1.08350, which aligns with the lower boundary of the descending triangle.
Conclusion and Consideration:
The EUR/USD technical analysis on the pair’s H4 chart suggests a bearish outlook, particularly with the price nearing a critical support level within a descending triangle. The technical indicators align with this view, signaling potential downside risks if the support at 1.08962 is breached. Traders should keep an eye on the upcoming economic data releases as they could have significant effects on the Fiber’s fundamental analysis. Given the current technical setup, short positions might be favored, but caution is advised, especially around key support and resistance levels.
Disclaimer: The provided analysis is for informational purposes only and does not constitute investment advice. Traders should conduct their own research and analysis before making any trading decisions.