Time Zone: GMT +3
Time Frame: 4 Hours (H4)
Fundamental Analysis:
The AUD/NZD currency pair represents the exchange rate between the Australian Dollar (AUD) and the New Zealand Dollar (NZD). The recent economic data from both countries indicate potential influences on this pair. Australia’s economic releases, including Retail Sales and Trade Balance, show a robust economic environment. Higher-than-expected Retail Sales figures suggest strong consumer spending, which is positive for the AUD. On the other hand, New Zealand’s employment data, such as the Unemployment Rate and Employment Change, also show positive trends, which can strengthen the NZD. However, given the overall economic conditions and central bank policies, the AUD appears poised for a bullish movement against the NZD.
Price Action:
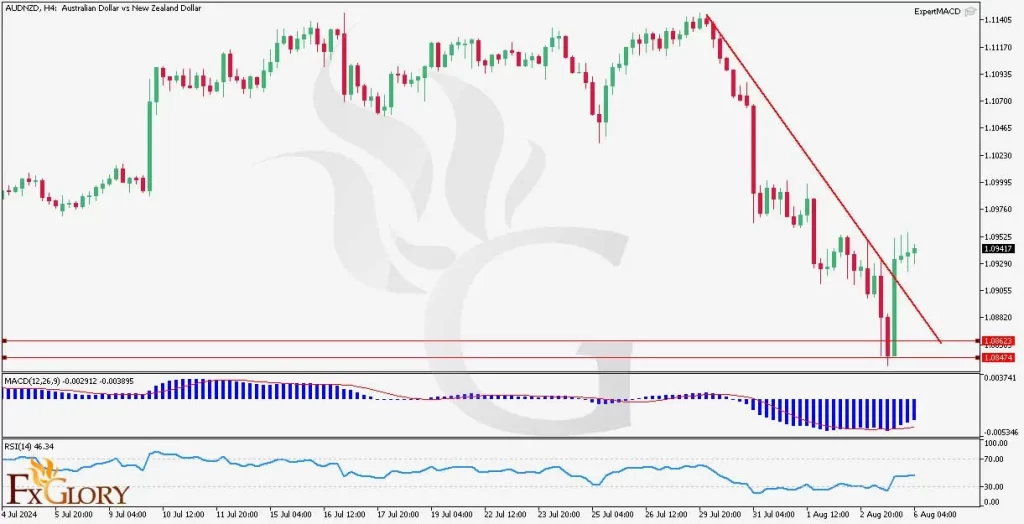
The AUDNZD pair analysis on the H4 timeframe shows a potential end to the recent bearish trend. The price has broken out of a descending trend line, suggesting a possible reversal or a pause in the bearish momentum. The candlestick pattern indicates a recovery, with green candles emerging after hitting a significant support level.
Key Technical Indicators:
MACD (Moving Average Convergence Divergence): The MACD indicator shows a bullish crossover, where the MACD line has crossed above the signal line, indicating a potential shift to bullish momentum. The histogram also supports this with increasing positive values, suggesting that the buying pressure is intensifying.
RSI (Relative Strength Index): The RSI has recovered from the oversold area, moving above the 30 level, which signals the end of bearish momentum and the start of a potential bullish run.
Support and Resistance:
Support: Immediate support is located at 1.08555, a level that has been tested recently and held firm, indicating strong buying interest at this level.
Resistance: The nearest resistance level is at 1.09416, which coincides with recent highs and the breakout area of the descending trend line.
Conclusion and Consideration:
The AUDNZD pair on the H4 chart indicates a potential bullish reversal, supported by the MACD and RSI indicators. The breakout of the descending trend line and the price recovery from the support level of 1.08555 suggest that the bulls might be taking control. Traders should consider this bullish scenario and look for buying opportunities on retracements, particularly around the 1.08555 support area. Monitoring upcoming economic releases from both Australia and New Zealand will be crucial, as they can introduce significant volatility and potentially alter the trend dynamics.
Disclaimer: The AUDNZD provided analysis is for informational purposes only and does not constitute investment advice. Traders should conduct their own research and analysis before making any trading decisions. Market conditions can change rapidly, and it is essential to stay updated with the latest information. Always consider risk management strategies and consult with a financial advisor if necessary.