Time Zone: GMT +3
Time Frame: 4 Hours (H4)
Fundamental Analysis:
The EUR/USD news analysis is set to be influenced by several low-impact news releases today, including the Spanish, Italian, French, German, and overall Eurozone Services PMI. These PMI releases are crucial as they provide insight into the economic health and business conditions in the services sector. A reading above 50.0 indicates industry expansion, while below signifies contraction. Moreover, the Sentix Investor Confidence and Producer Price Index (PPI) m/m data will further contribute to market sentiment. For the US Dollar (USD), the key events to watch are the medium-impact Final Services PMI with a forecast of 56.0, and the high-impact ISM Services PMI expected to be at 51.4. Both these indicators are critical as they reflect the economic health and business conditions in the US non-manufacturing sector.
Price Action:
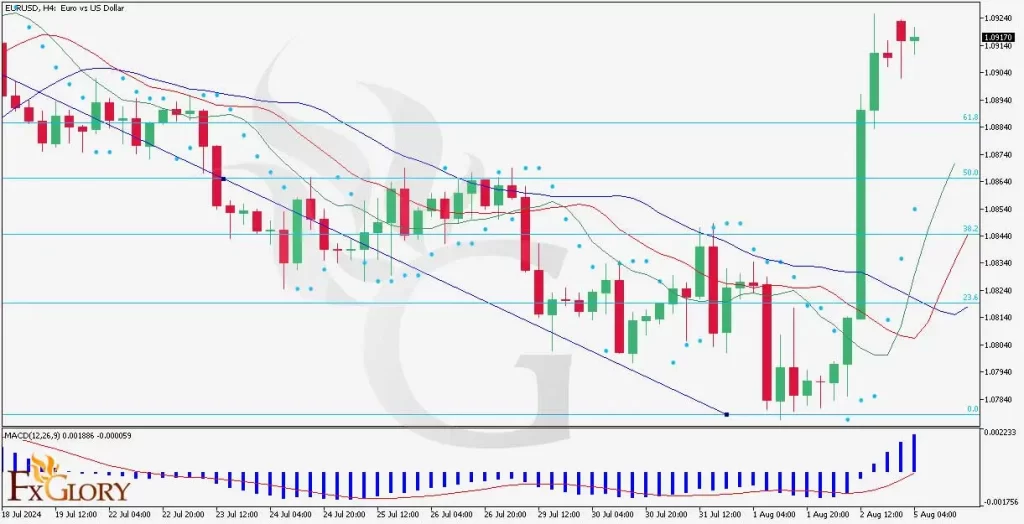
The EURUSD pair on the H4 timeframe recently exhibited a significant bullish momentum. The price action indicates a breakout from the previous downtrend, marked by a steep rise in the past few sessions. The sharp increase in price has broken through several resistance levels, indicating strong bullish sentiment.
Key Technical Indicators:
Parabolic SAR: The Parabolic SAR (Stop and Reverse) indicator has placed its last spots below the candles, suggesting a bullish trend. The sharp increase in price aligns with the SAR’s indication, confirming a strong upward momentum.
Alligator: The Alligator indicator, consisting of the Jaw (blue line), Teeth (red line), and Lips (green line), shows a widening of the lines. This indicates a trending market. The Lips (green) have crossed above the Teeth (red) and Jaw (blue), which supports the bullish trend and suggests that the market is waking up to a new upward direction.
MACD (Moving Average Convergence Divergence): The MACD line has crossed above the signal line with the histogram showing increasing bullish momentum. This crossover and the rising histogram bars indicate a strengthening bullish trend, reinforcing the recent upward price action.
Support and Resistance Levels:
Support Levels: The immediate support level is at 1.0840 (23.6% Fibonacci retracement level), followed by 1.0784 (0.0% Fibonacci retracement level).
Resistance Levels: The key resistance level to watch is at 1.0917, followed by 1.0960 (61.8% Fibonacci retracement level).
Conclusion and Consideration:
The EURUSD H4 chart exhibits a robust bullish trend driven by strong upward price action and supported by key technical indicators such as Parabolic SAR, Alligator, and MACD. The market’s recent breakout from the downtrend signals potential for further gains. However, traders should consider the upcoming economic news releases for both EUR and USD, which could introduce volatility and impact the price direction.
Disclaimer: The EURUSD provided analysis is for informational purposes only and does not constitute investment advice. Traders should conduct their own research and analysis before making any trading decisions. Market conditions can change rapidly, and it is essential to stay updated with the latest information.