Time Zone: GMT +3
Time Frame: 4 Hours (H4)
Fundamental Analysis:
The USD/JPY currency pair reflects the exchange rate between the US Dollar (USD) and the Japanese Yen (JPY). Today, the USD is poised for significant volatility with key economic releases including Average Hourly Earnings, Non-Farm Employment Change, and the Unemployment Rate. The Average Hourly Earnings forecast is at 0.3%, which is a leading indicator of consumer inflation. A higher-than-expected figure is positive for the USD. The Non-Farm Employment Change forecast stands at 176K, indicating potential job growth. The Unemployment Rate is forecasted at 4.1%, and a lower-than-expected figure would be favorable for the USD. These indicators are crucial as they impact consumer spending and overall economic health, which traders will scrutinize closely.
Price Action:
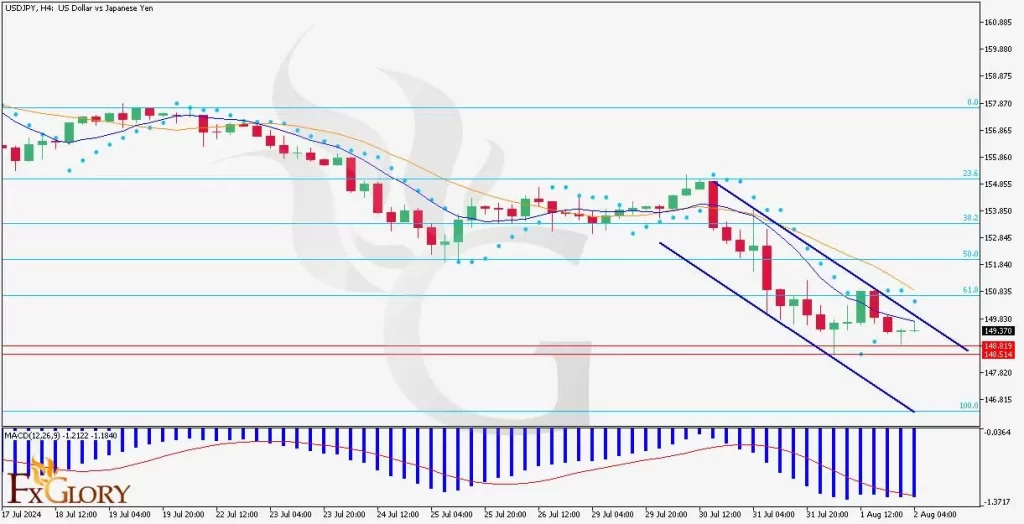
The USDJPY pair analysis on the H4 timeframe shows a clear bearish trend. The price has been consistently moving within a descending channel, highlighted by lower highs and lower lows. Recently, the price has tested the lower boundary of the channel, indicating continued bearish pressure. The presence of red candlesticks dominates, confirming the downward momentum. Traders should note the current consolidation near the lower channel line, which might suggest a potential pause or reversal, but the overall trend remains bearish.
Key Technical Indicators:
Moving Averages (MA 17 and MA 9): The 9-period MA is below the 17-period MA, indicating a bearish trend. This alignment supports the downward price movement observed in recent sessions. The convergence and subsequent crossing of the MAs have reinforced the selling pressure.
Parabolic SAR: The Parabolic SAR dots have shifted above the candles, signaling a bearish trend. Despite a brief change indicated by two spots below the candles, the last three dots have switched back above, confirming the resumption of the bearish trend.
MACD (Moving Average Convergence Divergence): The MACD line has crossed below the signal line, indicating bearish momentum. The histogram supports this with increasing negative values, suggesting that the selling pressure is intensifying. This bearish crossover aligns with the overall downward trend of the pair.
Support and Resistance:
Support: Immediate support is located at 148.514, a level that has been tested multiple times recently. This support aligns with the lower boundary of the descending channel and a critical consolidation area.
Resistance: The nearest resistance level is at 150835, which coincides with the 61.8% Fibonacci retracement level. This level has acted as a significant barrier in recent attempts to reverse the trend.
Conclusion and Consideration:
The USDJPY pair on the H4 chart indicates sustained bearish momentum, supported by the alignment of the moving averages, Parabolic SAR, and MACD indicators. The USDJPY price action within the descending channel suggests that the bears are still in control. Traders should consider the impact of the upcoming US economic data releases, which could introduce significant volatility and potentially alter the trend dynamics. It is crucial to monitor these indicators and adjust positions accordingly.
Disclaimer: The USDJPY provided analysis is for informational purposes only and does not constitute investment advice. Traders should conduct their own research and analysis before making any trading decisions. Market conditions can change rapidly, and it is essential to stay updated with the latest information. Always consider risk management strategies and consult with a financial advisor if necessary.