Time Zone: GMT +3
Time Frame: 4 Hours (H4)
Fundamental Analysis:
The GBP/USD news analysis today is influenced by a variety of fundamental factors. The British Pound is currently affected by the economic outlook in the UK, including inflation rates, interest rates set by the Bank of England, and the overall economic performance as reflected in GDP and employment data. The US Dollar, on the other hand, is influenced by similar factors in the United States, including Federal Reserve policies, inflation rates, and employment figures. Today’s economic calendar includes several important data releases for the USD, such as Unemployment Claims and ISM Manufacturing PMI, which are expected to have a high impact on the currency. These releases could provide significant volatility and direction to the GBP/USD pair, also known as the “Cable”.
Price Action:
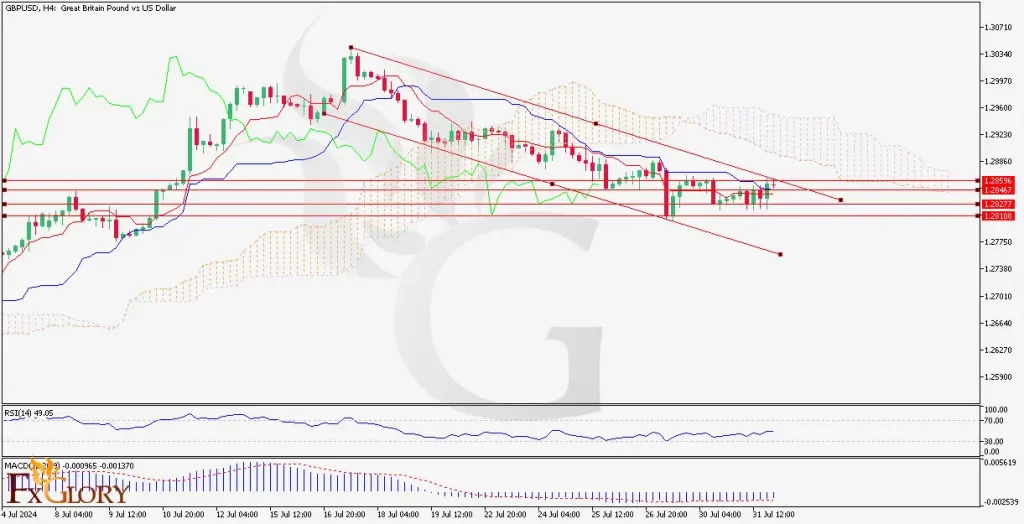
The GBP/USD H4 chart shows the pair trading in a descending channel with clear lower highs and lower lows, indicating the pair’s bearish trend. However, the Cable’s recent price action suggests a consolidation phase around the 1.2830 – 1.2865 range, which may be forming a base for a potential reversal or continuation pattern. The price is currently testing the upper boundary of the channel, indicating a crucial decision point.
Key Technical Indicators:
Ichimoku Cloud: The price is trading below the Ichimoku cloud, suggesting a bearish outlook. The cloud ahead is bearish, providing potential resistance for any upward movement.
RSI (Relative Strength Index): The RSI is around the neutral 49 level, suggesting neither overbought nor oversold conditions. This indicates a lack of strong momentum in either direction, aligning with the current consolidation phase.
MACD (Moving Average Convergence Divergence): The MACD line is below the signal line, and the histogram is in negative territory, indicating bearish momentum. However, the narrowing histogram suggests weakening bearish momentum, which could precede a bullish crossover.
Support and Resistance:
Support Levels: The immediate support levels for the currency pair are at 1.2827 and 1.2810, providing crucial price points where buying interest might emerge to prevent further decline.
Resistance Levels: The resistance levels are at 1.2846 and 1.2865, acting as key barriers where selling pressure might intensify, potentially halting any upward movement.
Conclusion and Consideration:
The GBP/USD technical analysis today shows that the pair is currently in a consolidation phase within a broader downtrend. Key indicators such as the Ichimoku cloud and MACD suggest a bearish bias, while the RSI shows a neutral stance. The upcoming economic releases for the USD, particularly the Unemployment Claims and ISM Manufacturing PMI, could introduce significant volatility to the pair’s forecast. Traders should monitor these data points closely, as they could determine the pair’s next direction. A break above the 1.2865 resistance could signal a potential trend reversal, while a drop below 1.2827 could confirm the continuation of the bearish trend.
Disclaimer: The provided analysis is for informational purposes only and does not constitute investment advice. Traders should conduct their own research and analysis before making any trading decisions.