Time Zone: GMT +3
Time Frame: 4 Hours (H4)
Fundamental Analysis:
The EUR/USD news analysis today is influenced by various fundamental factors such as macroeconomic indicators, central bank policies, and geopolitical events. For the Euro, recent data releases from INSEE indicate changes in consumer spending and GDP, which are vital for understanding the economic health of the Eurozone. Positive readings typically strengthen the Euro. On the US side, upcoming data on house prices and consumer confidence are crucial. The US Federal Reserve’s monetary policy decisions also play a significant role, with higher interest rates potentially boosting the USD, consequently affecting the pair also known as the Fiber.
Price Action:
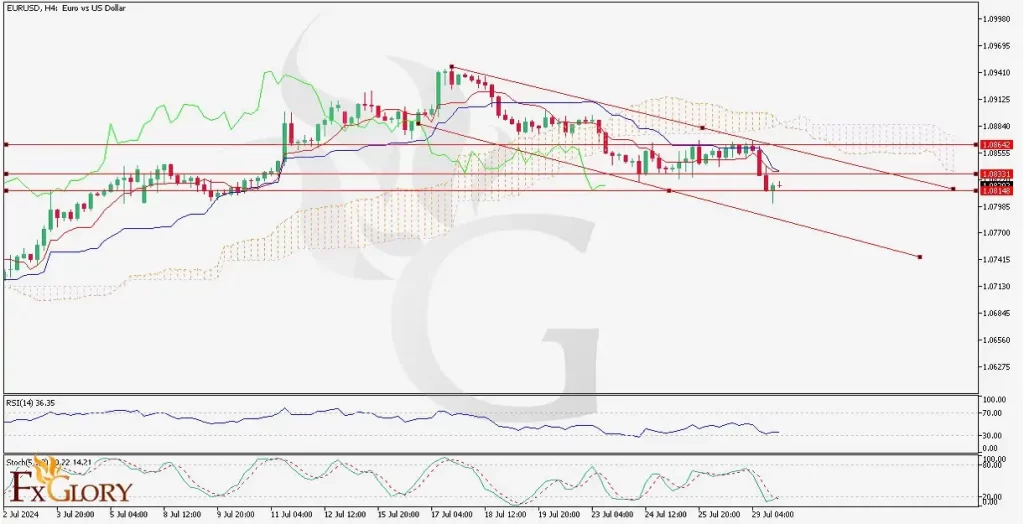
The EUR/USD H4 chart shows the pair’s clear bearish trend, with the price moving below the Ichimoku cloud, indicating a strong downtrend. The price has recently tested and broken through significant support levels, and there is a descending channel evident, further confirming the bearish sentiment. The Fiber’s price action suggests continued downward pressure unless a significant reversal signal appears.
Key Technical Indicators:
Ichimoku Cloud: The price is trading below the Ichimoku cloud, indicating bearish momentum. The future cloud is bearish, suggesting that the downtrend might continue. The Tenkan-Sen is below the Kijun-Sen, reinforcing the bearish outlook.
RSI (Relative Strength Index): The RSI is at 36.35, which is in the bearish zone but not yet oversold. This indicates that there might still be room for further downside before a potential reversal or correction.
Stochastic Oscillator: The Stochastic is at 20.22/14.21, indicating oversold conditions. This could suggest that a short-term bounce or correction might be on the horizon if the market finds some support.
Support and Resistance:
Support Levels: The immediate support level is at 1.08148, with further support at 1.07600, the lower bound of the descending channel.
Resistance Levels: The nearest resistance is at 1.08331, followed by 1.08555 and 1.08842, which are the upper bounds of the recent price consolidation and descending channel.
Conclusion and Consideration:
The EUR/USD technical analysis today on the H4 chart shows a strong bearish trend reinforced by key technical indicators. The price is trading below the Ichimoku cloud, the RSI indicates bearish momentum, and the Stochastic suggests oversold conditions. Traders should monitor the support at 1.08148 closely; a break below this level could signal further downside. However, oversold conditions might lead to a short-term corrective bounce. As for the pair’s fundamental analysis, data releases from both the Eurozone and the US could provide additional volatility and direction. Risk management is crucial in such a volatile environment, and setting appropriate stop-loss levels is advised.
Disclaimer: The provided analysis is for informational purposes only and does not constitute investment advice. Traders should conduct their own research and analysis before making any trading decisions.