Time Zone: GMT +3
Time Frame: 4 Hours (H4)
Fundamental Analysis:
The GBP/USD news analysis today is significantly influenced by economic indicators from both the United Kingdom and the United States. For the UK, factors such as changes in the money supply, mortgage approvals, and new credit issuance play crucial roles. The recent data from the Bank of England shows an increase in money circulation and credit issuance, suggesting an optimistic economic outlook. In the US, economic indicators such as interest rates, inflation, and job reports affect the dollar. The upcoming Bank of England reports will provide further insights into the UK’s economic health, impacting the GBP/USD forecast today.
Price Action:
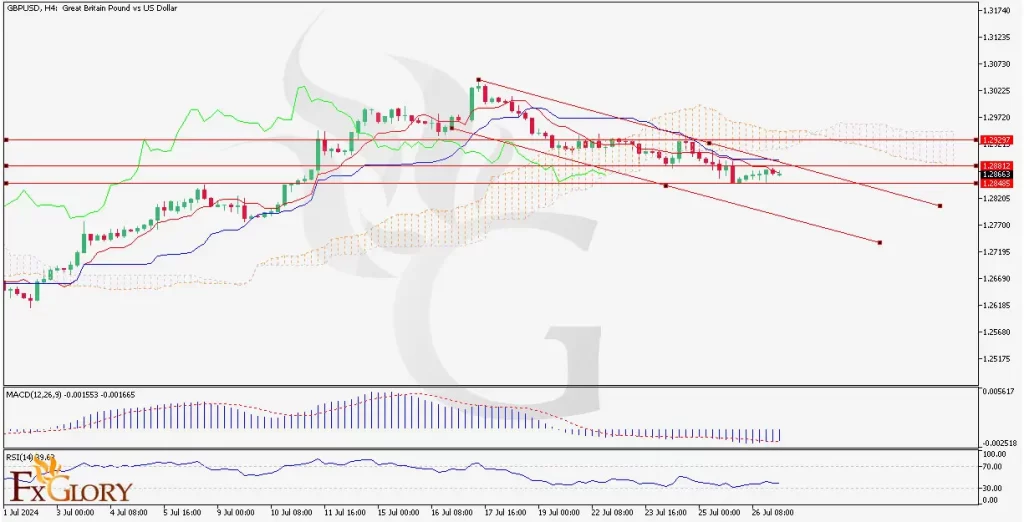
The GBP/USD H4 chart is exhibiting a downtrend, as indicated by the descending channel formed by the red trend lines. The price is consistently making lower highs and lower lows. The pair also known as the Cable, is struggling to break above the resistance provided by the upper trend line of the channel. This pattern indicates the pair’s bearish sentiment.
Key Technical Indicators:
Ichimoku Cloud: The price has broken below the Ichimoku Cloud, indicating a bearish trend. The conversion line (Tenkan-sen) is below the baseline (Kijun-sen), supporting the bearish outlook. The cloud ahead is bearish, suggesting continued downward pressure.
RSI (Relative Strength Index): The RSI is currently at 39.70, indicating the market is approaching oversold conditions. A value below 30 would signal an oversold market, potentially leading to a corrective bounce.
MACD (Moving Average Convergence Divergence): The MACD line is below the signal line, and the histogram is in negative territory, signaling bearish momentum. The divergence between the MACD and the signal line suggests a strengthening downward momentum.
Support and Resistance:
Support Levels: The immediate support level is around 1.26690, which aligns with the lower trend line of the descending channel.
Resistance Levels: The nearest resistance is around 1.29215, where the price has previously attempted to break above but failed.
Conclusion and Consideration:
The GBP/USD technical analysis today shows the pair’s bearish trend on the H4 timeframe, confirmed by the Ichimoku Cloud, MACD, and RSI indicators. Traders should look for potential sell opportunities, particularly if the price continues to respect the upper trend line of the descending channel. Monitoring upcoming economic releases from both the UK and the US will be crucial as they could influence the Cable’s price action. Traders should also be cautious of any corrective bounces that might occur if the RSI reaches oversold levels.
Disclaimer: The provided analysis is for informational purposes only and does not constitute investment advice. Traders should conduct their own research and analysis before making any trading decisions.