Time Zone: GMT +3
Time Frame: 4 Hours (H4)
Fundamental Analysis:
Today’s BTC/USD pair Analysis could be significantly impacted by U.S. political developments, notably President Biden’s unexpected decision to withdraw from the 2024 election and endorse Kamala Harris. This surprise political shift could introduce high volatility in the USD, potentially influencing Bitcoin as investors may look to cryptocurrencies as alternative investments during periods of uncertainty in traditional markets.
Price Action Analysis:
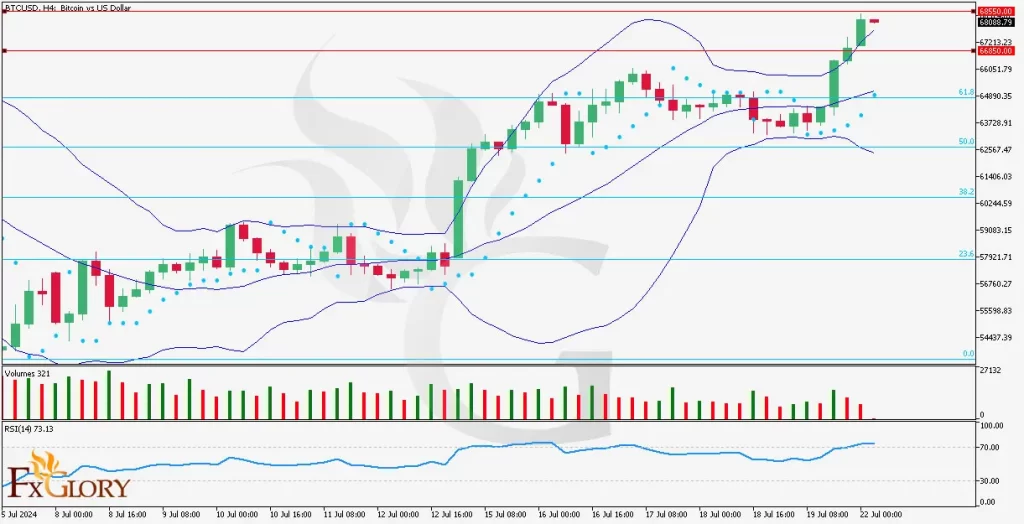
The BTC/USD chart shows a robust uptrend in the H4 timeframe, with recent candles demonstrating strong bullish momentum. The price has repeatedly touched and exceeded the upper Bollinger Band, suggesting strong buying interest. The series of higher highs indicates a continued positive sentiment among traders, pushing the price upwards.
Analysis of Key Technical Indicators:
Bollinger Bands: The bands are widening, indicating increased market volatility. The price touching the upper band suggests a strong upward trend but also signals potential overbought conditions which could lead to a temporary pullback.
Parabolic SAR (0.2): The positioning of the Parabolic SAR points below the candles confirms the current bullish trend, providing additional support levels for price movement.
Volume: The last three candles show red volume bars, indicating that while the price is increasing, it might be on decreasing trading volume. This could suggest a weakening of the current trend or potential consolidation.
RSI: The Relative Strength Index is over 70, supporting the strong bullish sentiment in the market. However, being in the overbought zone also raises the caution of a possible reversal or retracement, especially if the price faces resistance around $68,550.
Support and Resistance Levels:
Support: The primary support level is currently at around $66,850, providing a cushion should the price retract.
Resistance: The immediate resistance is observed near $68,550. Breaking this level could lead to further highs, potentially testing new resistance levels.
Conclusion and Consideration:
The current technical setup in BTC/USD on the H4 chart suggests a strong bullish trend, supported by several indicators. However, the potential overbought conditions indicated by the RSI and the Bollinger Bands call for cautious trading. Investors and traders should keep an eye on the mentioned support and resistance levels for potential entry or exit points.
Disclaimer: This analysis is for informational purposes only and should not be considered financial advice. Perform your own research and consult with a financial advisor. Market conditions can change rapidly, and it is crucial to stay informed and prepared for volatility, especially with impending significant U.S. political news.