Time Zone: GMT +3
Time Frame: 4 Hours (H4)
Fundamental Analysis:
The USD/CAD forex pair, reflecting the exchange rate between the US Dollar (USD) and the Canadian Dollar (CAD), is poised for a volatile session given today’s economic data releases. The USD is under scrutiny with low-impact events such as TIC Long-Term Purchases, which came in significantly lower than forecasted at -54.6B versus the expected 98.4B. Additionally, speeches from multiple FOMC members, including Daly, Bowman, Williams, and Bostic, are expected to provide further insights into future monetary policy, potentially influencing USD volatility. On the CAD side, high-impact data such as Core Retail Sales and Retail Sales, both forecasted at -0.5%, will be pivotal. These indicators are key gauges of consumer spending and economic health, likely to cause significant market movements if the actual figures deviate from expectations.
Price Action:
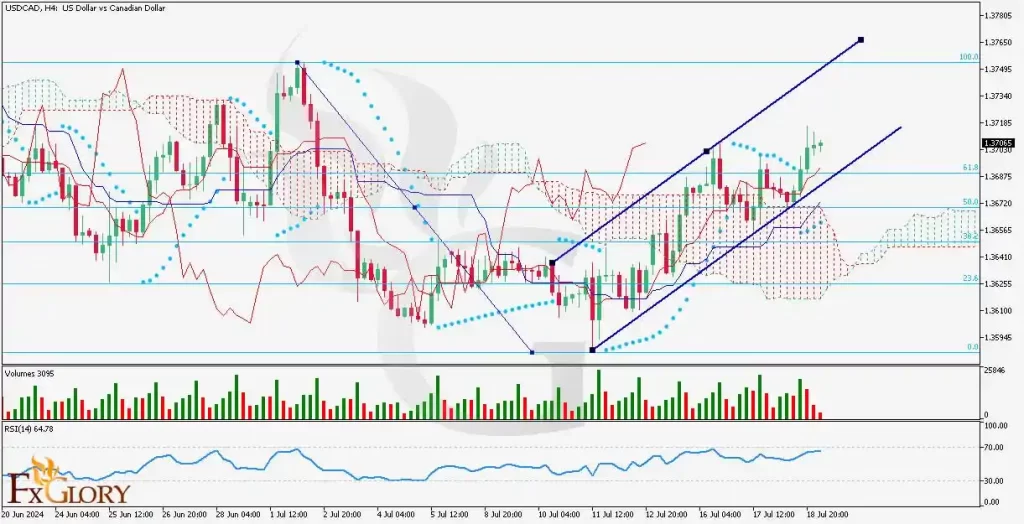
The USDCAD H4 chart shows a clear bullish trend. Over the past five candles, all have been bullish, indicating strong upward momentum. The price has broken through and passed the Ichimoku cloud, signifying a potential shift to a stronger bullish phase. The bullish candles suggest that the buyers are in control, pushing the price higher with each session.
Key Technical Indicators:
Ichimoku Cloud: The USDCAD price has moved above the Ichimoku cloud, a strong bullish signal suggesting that the trend might continue upwards. The cloud acts as a support zone, and breaking above it indicates a shift in momentum.
Volumes: The last three volume bars are red, indicating selling pressure despite the bullish price action. This divergence suggests caution, as increasing volume on bearish candles could signal potential weakness in the uptrend.
RSI (Relative Strength Index): The RSI is currently at 64.78, which is below the overbought level of 70. This suggests that there is still room for further upward movement before the market becomes overbought, supporting the bullish scenario.
Parabolic SAR: The Parabolic SAR dots are positioned below the last four candles, indicating a bullish trend. This indicator confirms the upward momentum and supports the continuation of the current trend.
Support and Resistance:
Support Levels: Immediate support is located at 1.3650, which aligns with the 50% Fibonacci retracement level and the lower boundary of the recent bullish channel.
Resistance Levels: The nearest resistance level is at 1.3785, which corresponds with the 78.6% Fibonacci retracement level and the upper boundary of the bullish channel.
Conclusion and Consideration:
The USDCAD H4 chart analysis shows a strong bullish trend, supported by the Ichimoku cloud, Volume, RSI, and Parabolic SAR indicators. The pair is currently experiencing robust upward momentum, with potential to reach higher resistance levels if the bullish trend continues. However, traders should remain cautious of upcoming economic data releases and FOMC member speeches, as these could introduce volatility and impact the current trend.
Disclaimer: The analysis provided for USDCAD is for informational purposes only and does not constitute investment advice. Traders should perform their own research and analysis before making any trading decisions. Market conditions can change rapidly, and it is crucial to stay updated with the latest information.