Time Zone: GMT +3
Time Frame: 4 Hours (H4)
Fundamental Analysis:
The AUD/USD forecast today is shaped by the economic health and policy decisions in both the United States and Australia. For the US, today’s data releases include Building Permits and Housing Starts, both crucial indicators of the housing market’s strength. Additionally, the Industrial Production m/m and Capacity Utilization Rate are key economic indicators to watch. Statements from FOMC Members Barkin and Waller, as well as the release of the Beige Book, will provide insights into the Fed’s economic outlook and potential policy changes. Crude Oil Inventories will also be monitored, given their influence on market sentiment and the broader economy.
Price Action:
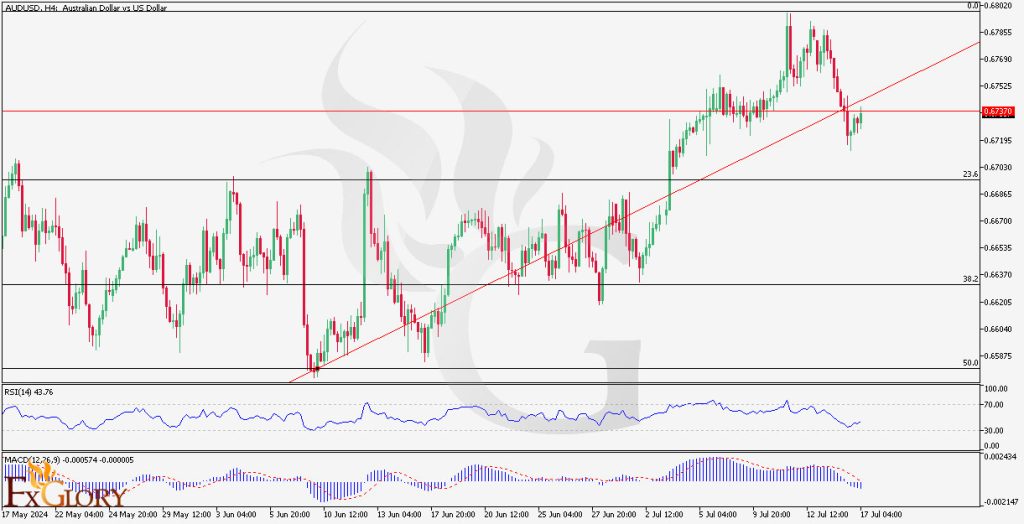
The EUR/CAD H4 chart is in a clear uptrend, characterized by higher highs and higher lows. The pair is currently trading above key support levels and is testing a significant resistance zone. The EUR/CAD price action indicates the pair’s strong bullish momentum, suggesting further potential upside.
Key Technical Indicators:
RSI (Relative Strength Index): The RSI is currently at 46.54, slightly below the neutral 50 level, indicating weakening bullish momentum. This supports the potential for further bearish moves unless the RSI rebounds above 50.
MACD (Moving Average Convergence Divergence): The MACD histogram is negative, with the MACD line below the signal line. This bearish crossover confirms the downside risk indicated by the price action and Parabolic SAR.
Support and Resistance:
Support Levels: The nearest support is at 0.67000, with additional support at 0.66715. These levels are critical for maintaining the current uptrend.
Resistance Levels: The pair is facing resistance at 0.67950 and stronger resistance at 1.48330. A break above these levels could signal a continuation of the bullish trend.
Conclusion and Consideration:
The AUD/USD H4 chart presents mixed signals, with the recent price action and technical indicators suggesting a potential trend reversal. The Parabolic SAR and MACD indicate bearish momentum, while the overall trend remains bullish. Traders should watch key support and resistance levels closely for potential breakouts or further bearish developments. Fundamental news releases for both the US and Australia will be crucial in influencing market sentiment and price direction. Monitoring these developments can provide valuable insights for trading decisions.
Disclaimer: The provided analysis is for informational purposes only and does not constitute investment advice. Traders should conduct their own research and analysis before making any trading decisions.