Time Zone: GMT +3
Time Frame: 4 Hours (H4)
Fundamental Analysis:
The EUR/USD news analysis today is influenced by several fundamental factors. Recent data from Eurostat indicates changes in the industrial production of the Eurozone, with the latest figures showing a positive trend, suggesting economic recovery. The upcoming Eurogroup meeting could further impact the EUR/USD forecast today as finance ministers discuss economic policies. On the USD side, key events include the Empire State Manufacturing Index, which provides insights into business conditions in New York state, and speeches by Federal Reserve officials, including Jerome Powell and Mary Daly, which could provide clues about future monetary policy.
Price Action:
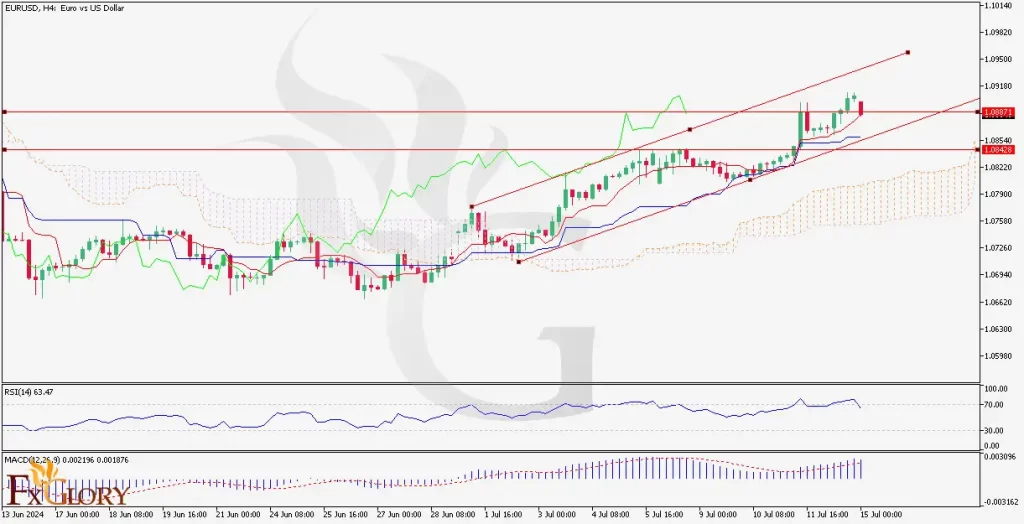
The EUR/USD H4 chart shows a consistent uptrend within a rising channel. The price has been making higher highs and higher lows, indicating the Fiber’s strong bullish trend. Currently, the pair’s price action shows that it is testing the upper boundary of the channel, suggesting potential resistance. A correction may occur before the pair continues its upward trajectory.
Key Technical Indicators:
Ichimoku Cloud: The price is trading above the Ichimoku Cloud, indicating the bullish trend of the pair. The cloud itself is also rising, further supporting the bullish outlook. The conversion line (blue) is above the baseline (red), which is another bullish signal.
RSI (Relative Strength Index): The RSI is at 63.47, which is in the bullish territory but not yet overbought. This suggests that there is still room for the price to move higher before hitting overbought conditions.
MACD (Moving Average Convergence Divergence): The MACD line is above the signal line, and the histogram shows positive values, indicating bullish momentum. However, the histogram bars are decreasing, which may suggest a weakening in the bullish momentum.
Support and Resistance:
Support Levels: The immediate support is at 1.0843, followed by a stronger support level at 1.0750.
Resistance Levels: The immediate resistance is at 1.0987. If the price breaks above this level, the next target would be 1.1050.
Conclusion and Consideration:
The EUR/USD technical analysis today shows the Fiber’s strong bullish signs on the H4 chart, supported by key technical indicators like the Ichimoku Cloud, RSI, and MACD. While the RSI indicates there is still room for growth, traders should watch for potential resistance at the current levels. The pair’s Fundamental factors such as economic data releases from the Eurozone and the US, as well as comments from Federal Reserve officials, could impact the pair’s movement. Traders should consider these events and use proper risk management techniques, including stop losses, given the potential for volatility.
Disclaimer: The provided analysis is for informational purposes only and does not constitute investment advice. Traders should conduct their own research and analysis before making any trading decisions.