EUR/CAD Forecast — 20 September 2026
Time Zone: GMT +3
Time Frame: Daily (D1) / Weekly Outlook
Weekly Fundamental Overview:
EUR/CAD market sentiment remains tied to upcoming economic data from both Canada and the Eurozone. Key economic indicators, including Canadian GDP growth figures and Eurozone inflation metrics, will be closely evaluated by market participants to gauge potential monetary policy adjustments.
Price Action:
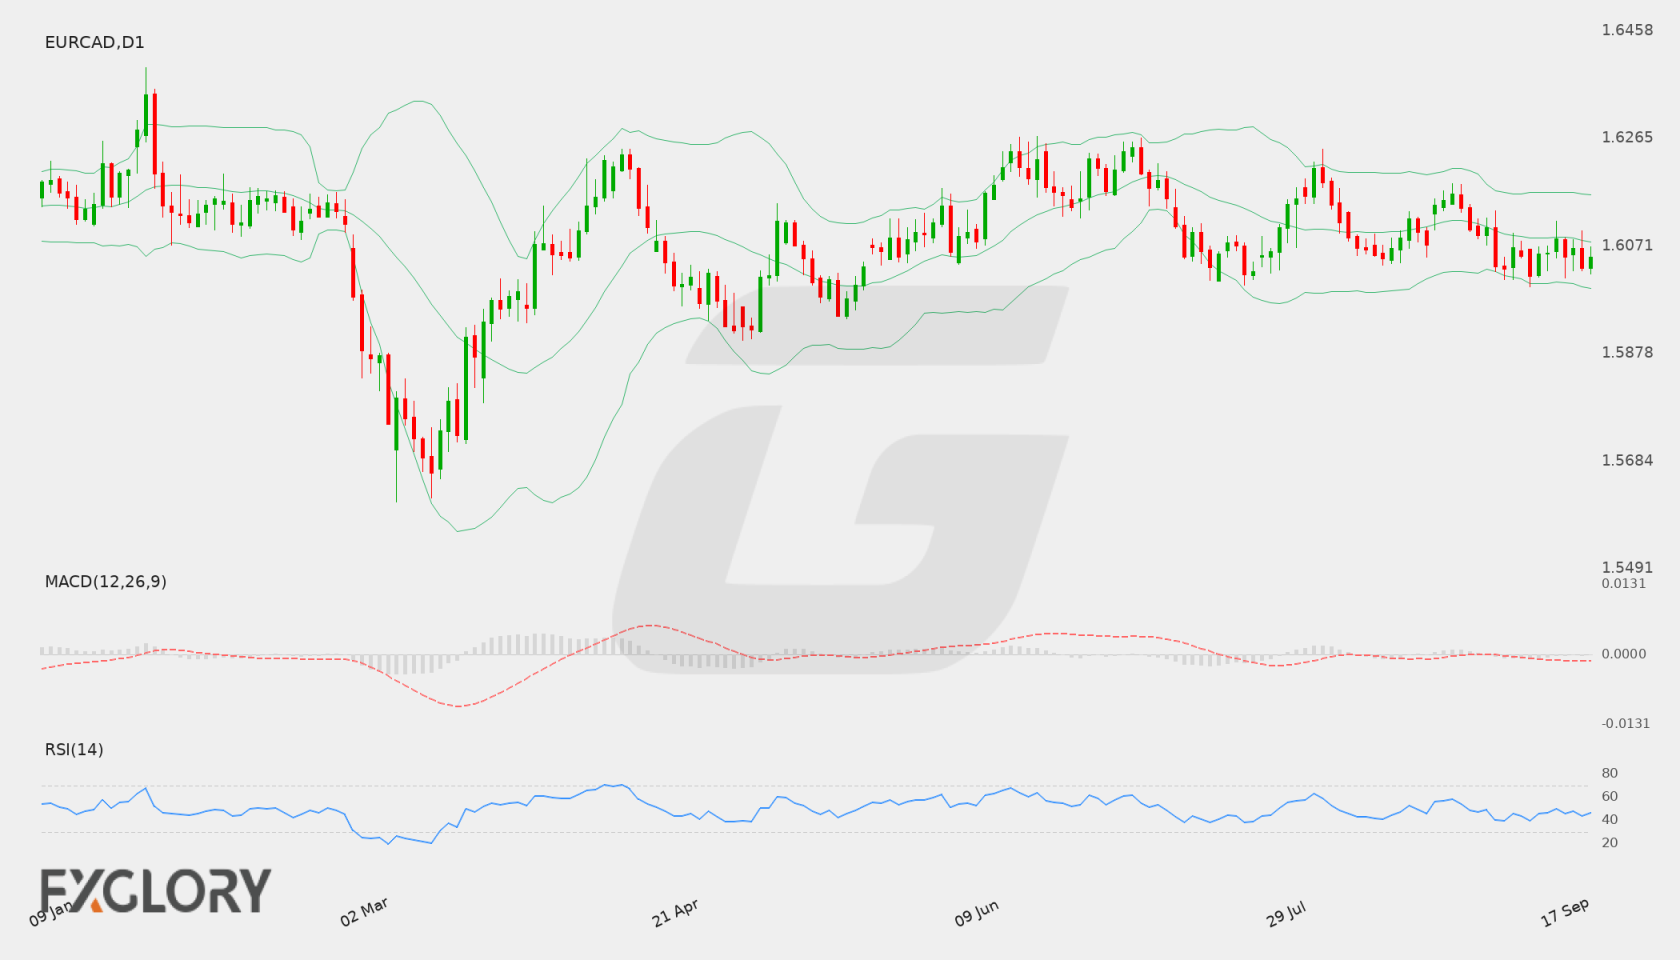
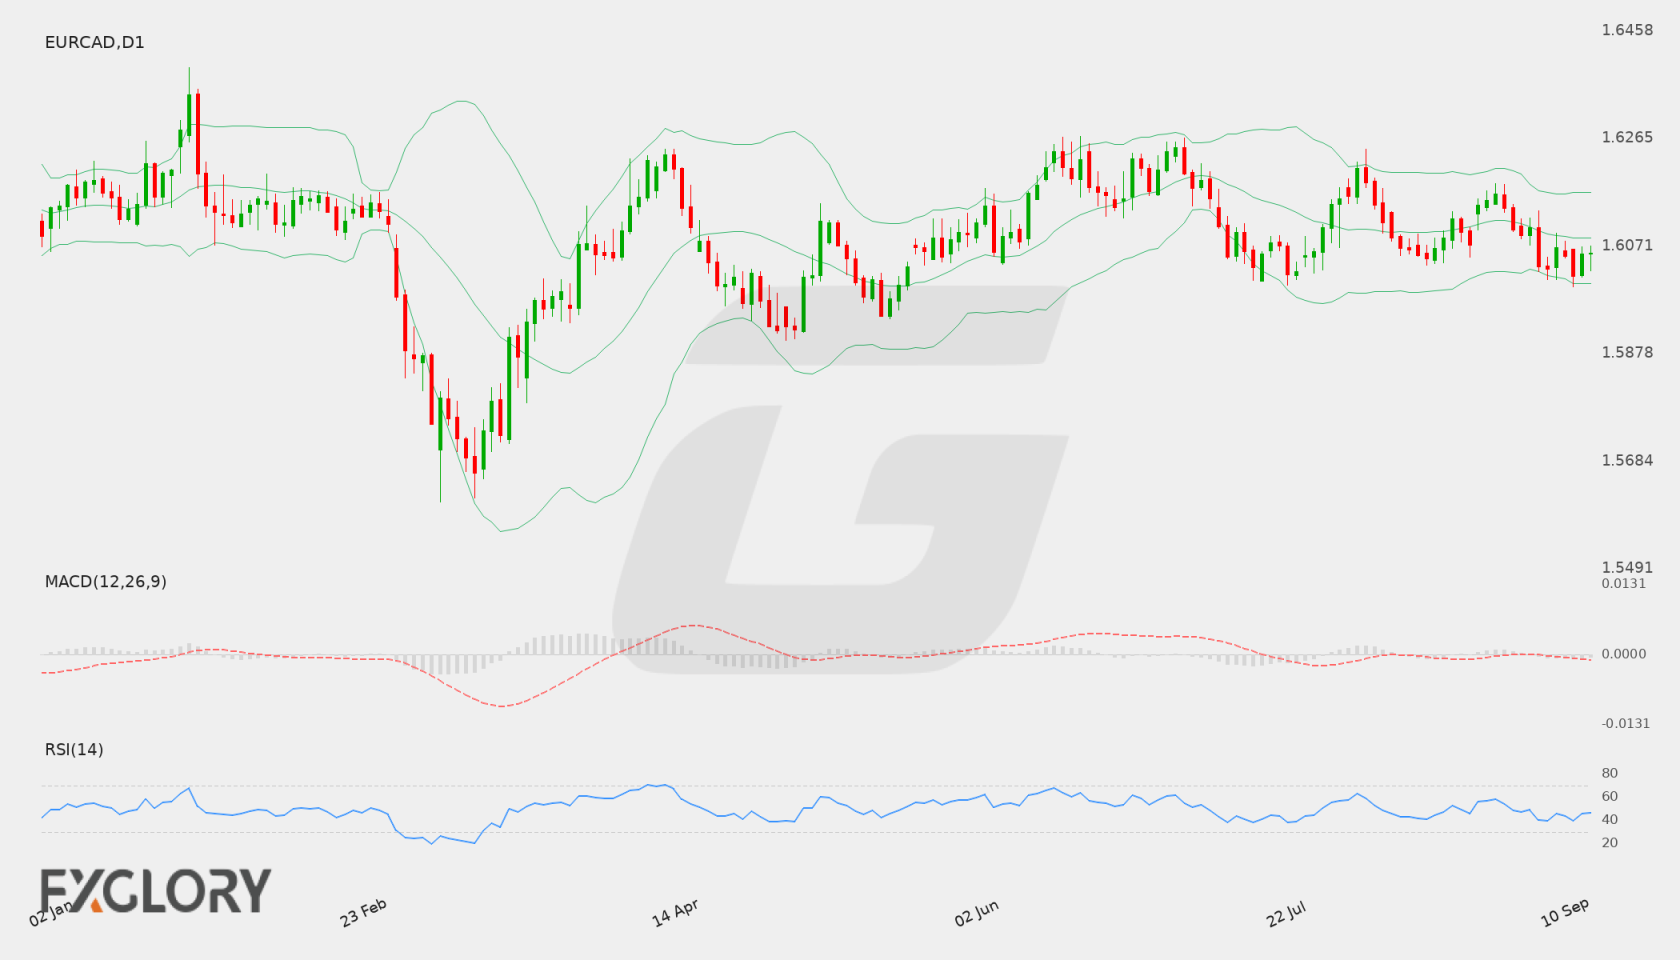
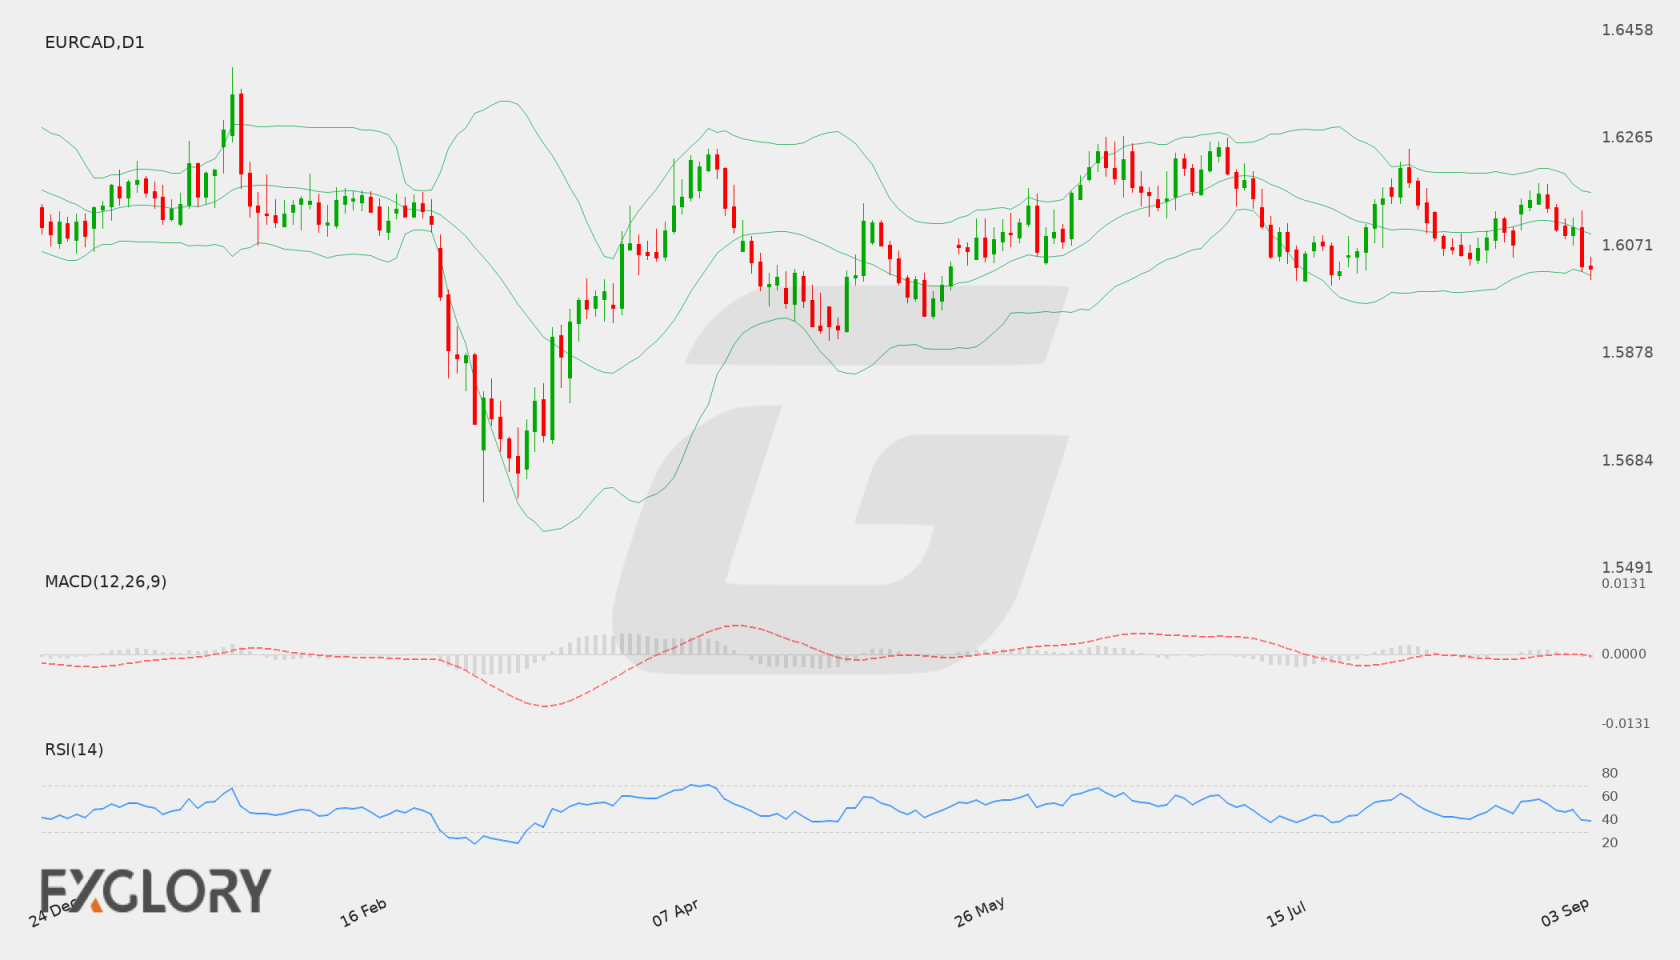
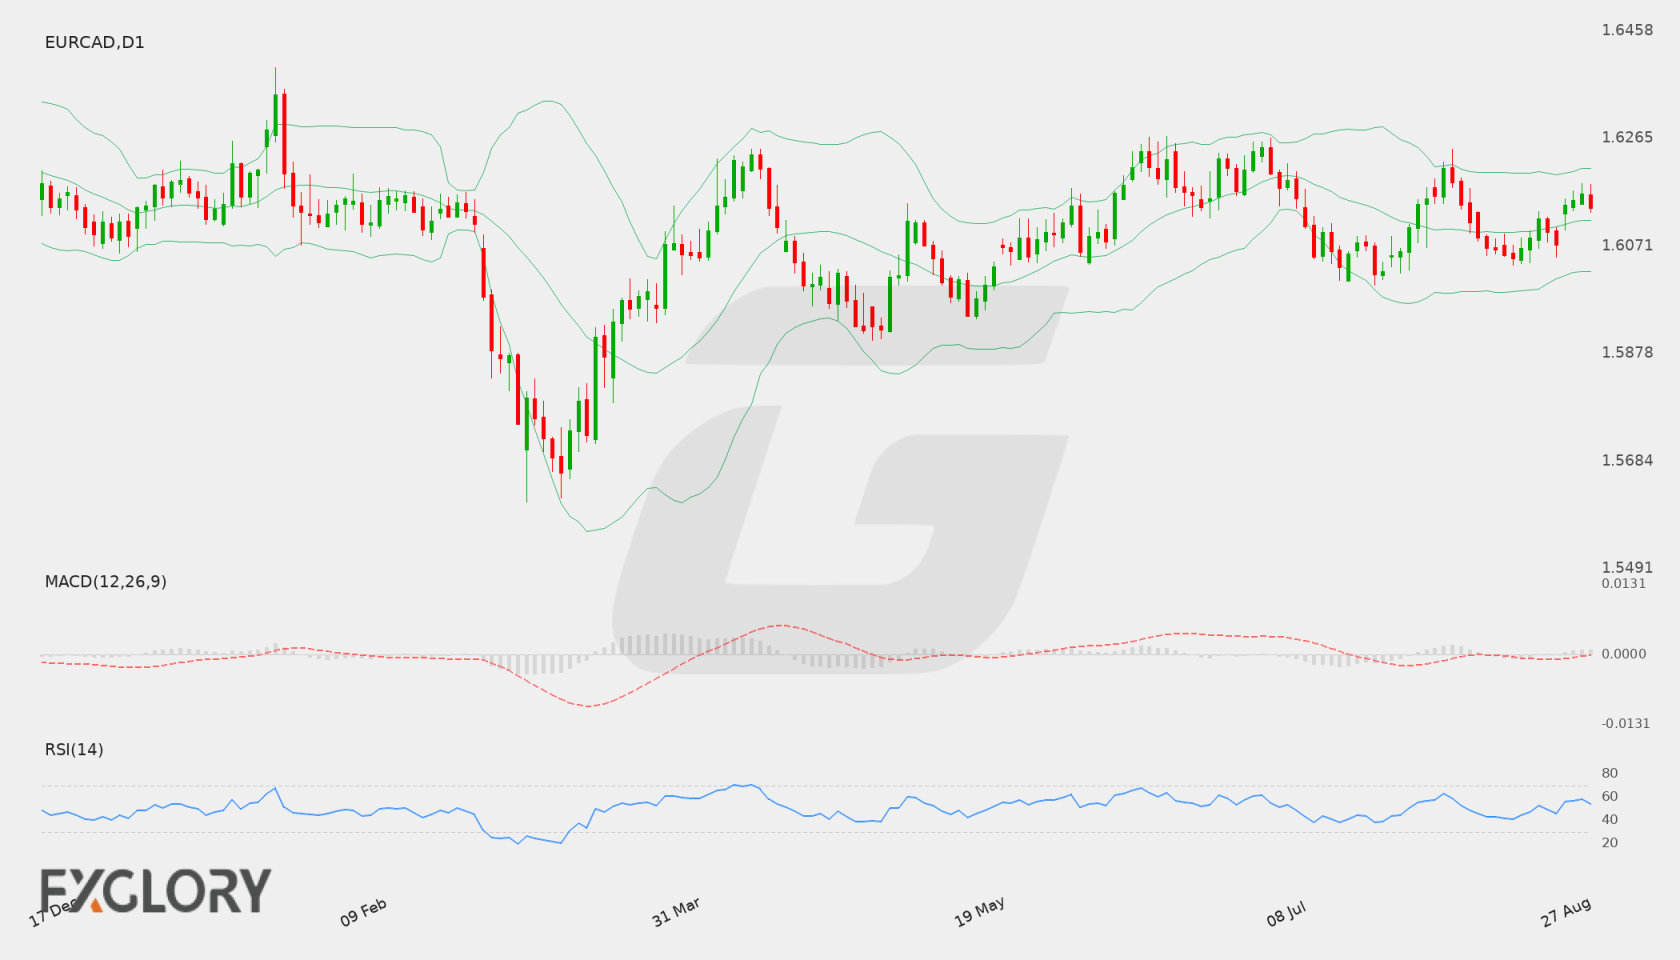
On the Daily (D1) chart, EUR/CAD has exhibited short-term consolidation around the 1.60502 closing level. Recent price candles reflect range-bound activity between recent minor session lows near 1.60180 and local session highs around 1.60835.
Key Technical Indicators:
Bollinger Bands: The D1 Bollinger Bands depict a middle band at 1.60788, an upper band at 1.61629, and a lower band at 1.59948. Price action closing at 1.60502 sits just below the middle line, signaling a neutral to slightly restrained market posture.
RSI: The 14-day Relative Strength Index (RSI) stands at 46.06, indicating a neutral state. This level indicates an absence of overbought or oversold conditions.
MACD: The MACD indicator is currently reading -0.00149, positioning it below the zero baseline. This negative value points to mild bearish bias without strong momentum expansion.
Support and Resistance:
Technical support for EUR/CAD is established near 1.59977, close to the lower Bollinger Band region. On the upside, key technical resistance is identified around 1.62649.
News to Watch for EURCAD This Week:
- GDP m/m: Canadian monthly economic growth figures may influence market sentiment and valuation.
- German Prelim CPI m/m: Preliminary German inflation data provides preliminary signals regarding price trends in the Eurozone.
- CPI Flash Estimate y/y: Headline Eurozone inflation figures offer broad insight into regional consumer price pressures.
- Core CPI Flash Estimate y/y: Underlying Eurozone inflation metrics help evaluate long-term price stability trends.
Weekly Outlook and Consideration:
EUR/CAD trades with a neutral bias following a close at 1.60502, situated slightly under the daily Bollinger middle band of 1.60788. Neutral RSI readings at 46.06 and a modest negative MACD at -0.00149 suggest bounded price movement. Key levels to monitor include support at 1.59977 and resistance at 1.62649, alongside key GDP and inflation data releases.
Disclaimer: The analysis provided for EUR/CAD is for informational purposes only and does not constitute investment advice. Traders are encouraged to perform their own analysis and research before making any trading decisions. Market conditions can change quickly, so staying informed with the latest data is essential.