Time Zone: GMT +3
Time Frame: 4 Hours (H4)
Fundamental Analysis:
The USDCAD forex pair represents the exchange rate between the US Dollar (USD) and the Canadian Dollar (CAD). Today, significant attention will be on USD due to high-impact economic releases including Core PPI (forecasted at 0.2%), PPI (forecasted at 0.1%), and Preliminary UoM Consumer Sentiment (forecasted at 68.5). These releases are crucial as they provide insights into producer inflation and consumer sentiment, which are leading indicators of overall economic activity. Positive figures can strengthen USD, leading to upward pressure on the USDCAD pair. On the CAD side, low impact is expected from the Building Permits m/m release, forecasted at -5.0%, which could show a slight downturn in construction activity.
Price Action:
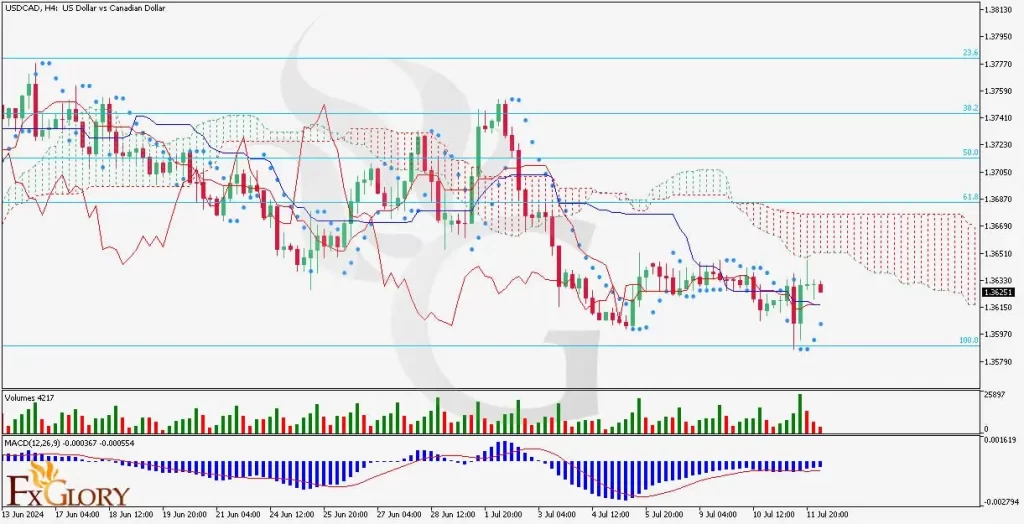
The USDCAD H4 chart shows the price action moving within a defined range, with recent candles indicating consolidation. The price recently touched the support levels around 1.3580 before attempting a recovery. However, the bearish momentum appears to dominate, with resistance levels near 1.3687 acting as a barrier for further upward movement.
Key Technical Indicators:
Parabolic SAR (0.2): The last four dots of the Parabolic SAR have been under the candles, indicating a bullish reversal attempt. However, the overall trend remains uncertain as these signals often need confirmation from other indicators.
Ichimoku Cloud: The Ichimoku Cloud is red and has widened, indicating bearish momentum. The candles are positioned below the cloud, reinforcing the bearish sentiment in the market.
Volumes: Trading volume has shown fluctuations, with recent bars indicating lower activity, which may suggest a lack of strong buying interest or a consolidation phase before a potential breakout.
MACD: The MACD indicator shows the MACD line slightly below the signal line with a histogram indicating weak bearish momentum. This suggests that while the overall trend is bearish, there could be room for a short-term bullish correction.
Support and Resistance:
Support Levels: The immediate support is at 1.3580, followed by a stronger support level at 1.3579.
Resistance Levels: The key resistance levels are at 1.3687 (aligned with the 61.8% Fibonacci retracement level) and 1.3720.
Conclusion and Consideration:
The USDCAD pair is currently facing mixed signals. Fundamentally, USD has the potential for strengthening due to positive economic data, while CAD is expected to show minimal impact from the Building Permits release. Technically, indicators suggest bearish momentum but with signs of a potential short-term bullish correction. Traders should monitor the high-impact USD data releases closely as they are likely to influence the pair’s direction significantly.
Disclaimer: The provided analysis is for informational purposes only and does not constitute investment advice. Traders should conduct their own research and analysis before making any trading decisions.