Time Zone: GMT +3
Time Frame: 4 Hours (H4)
Fundamental Analysis:
The EUR/USD forex pair analysis is currently influenced by several economic indicators and geopolitical factors. For the Euro, key influences include the latest European Central Bank (ECB) meeting minutes and upcoming economic data releases such as the ZEW Economic Sentiment Index and Eurozone Industrial Production figures. These indicators reflect the economic health of the Eurozone, which in turn affects the Euro’s strength. On the US side, recent speeches from Federal Reserve officials and USD-related economic data, including inflation rates and jobless claims, play a significant role. The Fed’s stance on monetary policy continues to be a critical driver for the USD, impacting the EUR/USD forecast today.
Price Action:
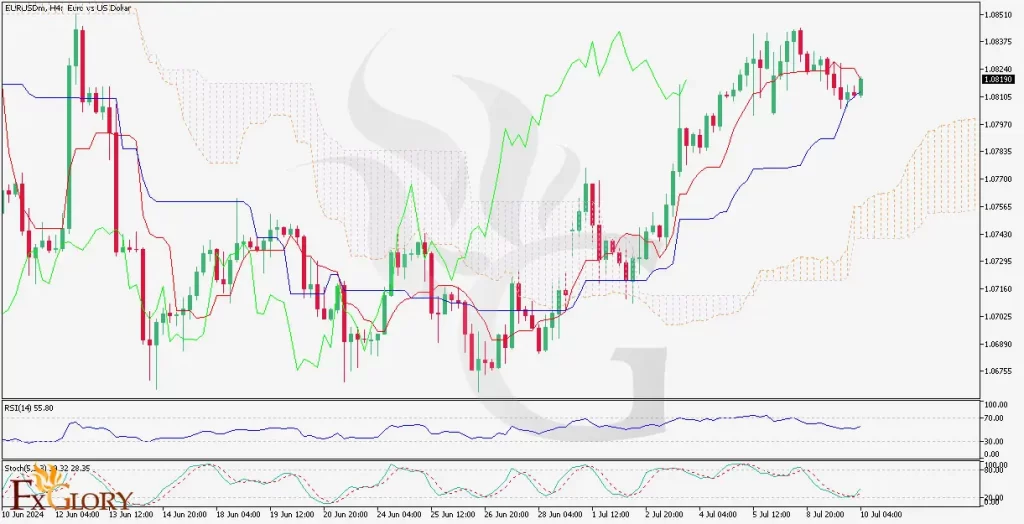
The EUR/USD H4 chart is displaying a bullish trend characterized by the price recently breaking above the Ichimoku cloud. This bullish breakout signifies the potential for further upward movement. After a correction phase, EURUSD appears to be resuming its ascending trend. The price action predictions suggest that if the current bullish momentum persists, the pair could test and possibly break through the identified resistance levels.
Key Technical Indicators:
Ichimoku Cloud:The price is trading above the Kumo (cloud), indicating a bullish trend and the Senkou Span A is above Senkou Span B, further supporting the bullish sentiment.
RSI (Relative Strength Index): The RSI is currently at 55.80, which is in bullish territory but not overbought. This suggests there is room for the price to move higher.
Stochastic Oscillator:The Stochastic (5, 3, 3) is at 39.32, indicating that the pair might have potential for further upward movement before reaching overbought conditions.
Support and Resistance:
Support: The nearest support level is at 1.07970, followed by more substantial support at 1.07350.
Resistance: The immediate resistance level is at 1.08510, with a significant resistance level at 1.07350, which aligns with the upper boundary of the ascending channel.
Conclusion and Consideration:
The EUR/USD technical analysis today shows a strong bullish trend on the H4 chart, supported by the Ichimoku cloud analysis and the current position of the RSI. The Stochastic indicator suggests potential for continued upward movement, provided the pair finds support at current levels. Traders should monitor key support and resistance levels, particularly the 1.08510 and 1.08560 resistance levels, for potential breakout opportunities. Given the upcoming economic data releases and statements from Federal Reserve officials, traders should remain cautious and employ proper risk management strategies.
Disclaimer: The provided analysis is for informational purposes only and does not constitute investment advice. Traders should conduct their own research and analysis before making any trading decisions.