Time Zone: GMT +3
Time Frame: 4 Hours (H4)
Fundamental Analysis:
The EUR/USD news analysis today is influenced by a variety of fundamental factors, including macroeconomic data, central bank policies, and geopolitical events. For the Euro, upcoming reports such as the German Trade Balance and Sentix Investor Confidence are low-impact but can provide insights into economic health. A higher-than-expected trade balance could be positive for the Euro, suggesting robust export activity. Similarly, a Sentix Investor Confidence reading above expectations could indicate optimism about the Eurozone economy. For the USD, the Consumer Credit m/m data is expected to be a low-impact release, but higher consumer credit could signal confidence in financial stability and spending power, potentially supporting the USD.
Price Action:
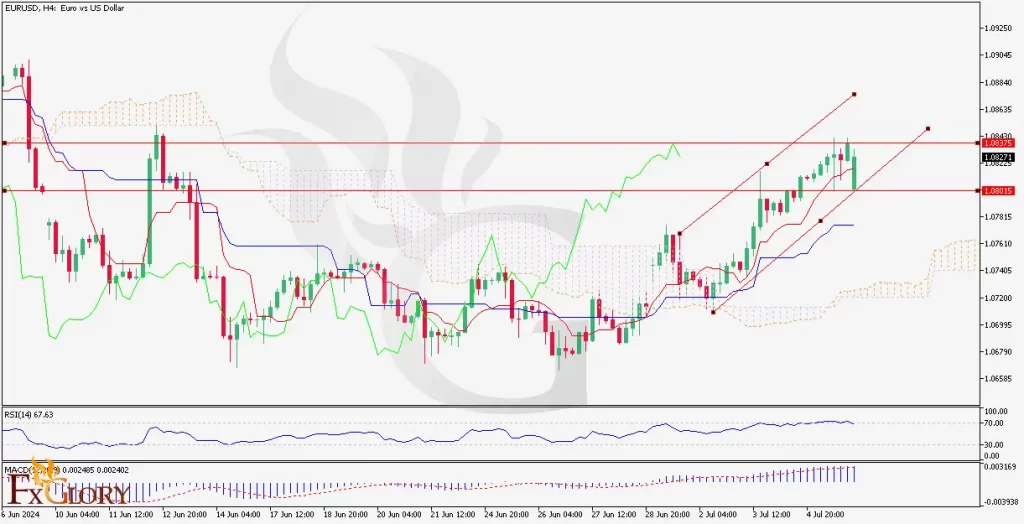
The EUR/USD H4 chart shows a visible bullish trend for the pair with the price moving within an ascending channel. The Fiber’s price action shows higher highs and higher lows, indicating bullish momentum. The pair has tested and pulled back from the upper boundary of the channel, suggesting a potential consolidation or retracement before continuing its upward movement.
Key Technical Indicators:
Ichimoku Cloud: The price is above the Ichimoku Cloud, indicating a bullish trend. The Tenkan-sen (red line) and Kijun-sen (blue line) are both pointing upwards, which supports the bullish outlook. The Chikou Span (lagging line) is above the price, further confirming the bullish trend.
RSI (Relative Strength Index): The RSI is currently at 67.63, close to the overbought territory (70). This suggests that while there is strong bullish momentum, the pair may be nearing an overbought condition, which could lead to a short-term correction.
MACD (Moving Average Convergence Divergence): MACD line above the signal line, indicating sustained bullish momentum. The upward trajectory of the MACD lines supports the potential for further gains.
Support and Resistance:
Support Levels: Immediate support is at the 1.08015 level, which aligns with the lower boundary of the ascending channel and the Kijun-sen.
Resistance Levels: The nearest resistance is at 1.08375, marked by the recent high. A break above this level could see the price testing higher resistance around 1.08640.
Conclusion and Consideration:
The EUR/USD pair on the H4 chart is in a clear uptrend, supported by the Ichimoku Cloud, RSI, and MACD indicators. The bullish momentum of the pair appears strong, but the RSI suggests the pair may be approaching an overbought condition, which could lead to a short-term pullback. Traders should watch for a break above the 1.08375 resistance level for confirmation of continued bullish movement. Key economic data releases for both EUR and USD should be monitored as they can influence market sentiment and price action. Proper risk management strategies, such as setting stop losses near support levels, are essential in managing potential market volatility.
Disclaimer: The provided analysis is for informational purposes only and does not constitute investment advice. Traders should conduct their own research and analysis before making any trading decisions.