Time Zone: GMT +3
Time Frame: 4 Hours (H4)
Fundamental Analysis:
The USD/CAD currency pair reflects the exchange rate between the US Dollar (USD) and the Canadian Dollar (CAD). Today, the USD is set to be influenced by several key economic data releases, including Average Hourly Earnings, Non-Farm Employment Change, and the Unemployment Rate. These high-impact events are crucial as they provide insights into labor market conditions and inflation, likely causing significant USD volatility. On the CAD side, the Employment Change and Unemployment Rate data are also due, which are essential indicators of economic health and could influence the CAD’s strength.
Price Action:
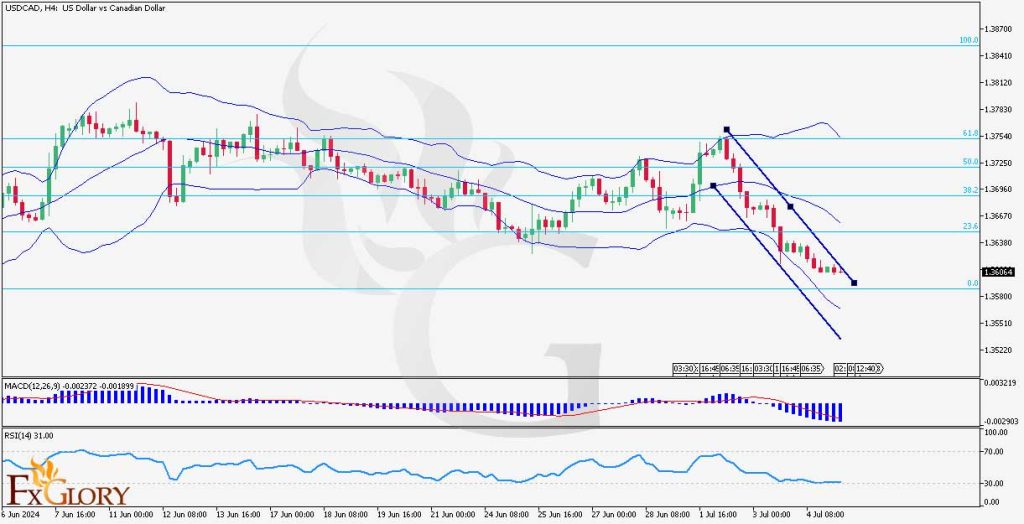
The USD/CAD pair on the H4 timeframe is in a clear bearish trend. The price is moving within the lower half of the Bollinger Bands, indicating sustained downward momentum. Despite occasional bullish corrections, the overall trend remains negative. Recent candles show a steady decline, aligning with the general bearish sentiment.
Key Technical Indicators:
Bollinger Bands: The Bollinger Bands have been widening, indicating increasing market volatility. The price has been predominantly in the lower half of the bands, which reinforces the bearish trend. The price nearing the lower band suggests potential oversold conditions, but the trend remains downward.
MACD (Moving Average Convergence Divergence): The MACD is in bearish territory, with the MACD line below the signal line and a negative histogram. This setup confirms the ongoing bearish momentum and suggests further downward movement unless a bullish crossover occurs.
RSI (Relative Strength Index): The RSI is currently around 31, approaching the oversold region. This low RSI value indicates that the price could be due for a short-term corrective bounce, but the overall bearish trend remains dominant.
Support and Resistance:
Support: Immediate support is at 1.3600, a key psychological level and recent low. Further support is at 1.3500, another significant level observed on longer timeframes.
Resistance: Immediate resistance is at 1.3700, aligning with the 23.6% Fibonacci retracement level. Additional resistance is at 1.3750, near the 38.2% Fibonacci level.
Conclusion and Consideration:
The USD/CAD pair on the H4 chart shows a strong bearish trend supported by key technical indicators such as Bollinger Bands, MACD, and RSI. The increasing volatility and bearish momentum suggest caution for traders looking to enter long positions. Upcoming high-impact economic data from both the US and Canada could introduce significant volatility, making it crucial for traders to stay informed and ready to react to new information.
Disclaimer: The provided analysis is for informational purposes only and does not constitute investment advice. Traders should conduct their own research and analysis before making any trading decisions.