Time Zone: GMT +3
Time Frame: 4 Hours (H4)
Fundamental Analysis:
The EUR/GBP news analysis today is influenced by various fundamental factors. For the Euro, industrial orders and bond yields within the Eurozone play a significant role, reflecting economic activity and investor confidence. In the UK, the focus is on the general election outcomes and PMI data, which indicate economic health and conditions within the construction industry. The upcoming UK general election is particularly crucial as it could shift economic policies and investor sentiment. Concurrently, the Eurozone’s bond yields and industrial orders data provide insights into economic trends and production outlooks, which are vital for the EUR/GBP dynamics.
Price Action:
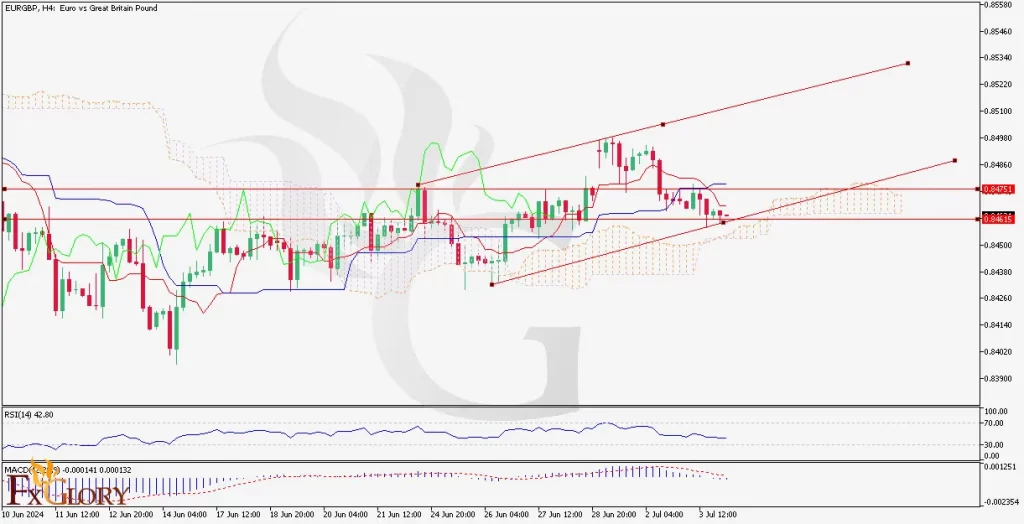
The EUR/GBP H4 chart shows the pair trading within an ascending channel, indicating the bullish trend of the pair over the medium term. However, Chunnel’s recent price action demonstrates a pullback towards the lower boundary of the channel, suggesting possible consolidation or a correction phase. The price is currently hovering around the support level of 0.84615, with a resistance level noted at 0.84751. A break below the support could indicate further bearish momentum, while a bounce back could signal a continuation of the bullish trend within the channel.
Key Technical Indicators:
Ichimoku Cloud: The Ichimoku Cloud analysis shows the price broke through the cloud and, after a bearish trend, is heading back towards the cloud but is not within it yet. The Tenkan-sen below the Kijun-sen and the Chikou Span being below the price indicate continued bearish sentiment.
RSI (Relative Strength Index): The RSI is at 42.80, indicating a moderately bearish sentiment. It is not yet in the oversold territory, implying that there could be more room for the price to decline before a reversal is expected.
MACD (Moving Average Convergence Divergence): The Stochastic lines are converging around the 30 level, which typically signals a potential upward reversal if they turn upwards, marking a key watch-out for buyers.
Support and Resistance:
Support Levels: The immediate support level is at 0.84615. A break below this level could lead to further declines towards the lower boundary of the ascending channel.
Resistance Levels: The resistance level is at 0.84751. A break above this level could indicate a continuation of the bullish trend towards the upper boundary of the ascending channel.
Conclusion and Consideration:
The EUR/GBP H4 chart forecast today presents a mixed outlook, with current bearish momentum but within a longer-term ascending channel. Traders should closely monitor the support level at 0.84615 and the resistance level at 0.84751 for potential breakouts. Given the indicators like the Ichimoku Cloud and RSI, there is a possibility of further decline, but the proximity to the cloud suggests potential stabilization. Traders should also keep an eye on fundamental data from the Eurozone and the UK, as these will significantly impact market sentiment and price action.
Disclaimer: The provided analysis is for informational purposes only and does not constitute investment advice. Traders should conduct their own research and analysis before making any trading decisions.