Time Zone: GMT +3
Time Frame: 4 Hours (H4)
Fundamental Analysis:
The GBP/USD news analysis today is influenced by various economic indicators and geopolitical factors. Recently, the pair’s performance has been under pressure due to a stronger US Dollar driven by positive economic data, including expectations for the upcoming Final Manufacturing PMI and ISM Manufacturing PMI. The UK’s economic outlook remains uncertain amidst concerns over inflation and slower-than-expected economic growth. Bank of England’s monetary policy and the broader macroeconomic environment continue to play pivotal roles. The USD has shown resilience due to the Federal Reserve’s hawkish stance, while the GBP faces headwinds from domestic economic challenges and Brexit-related uncertainties.
Price Action:
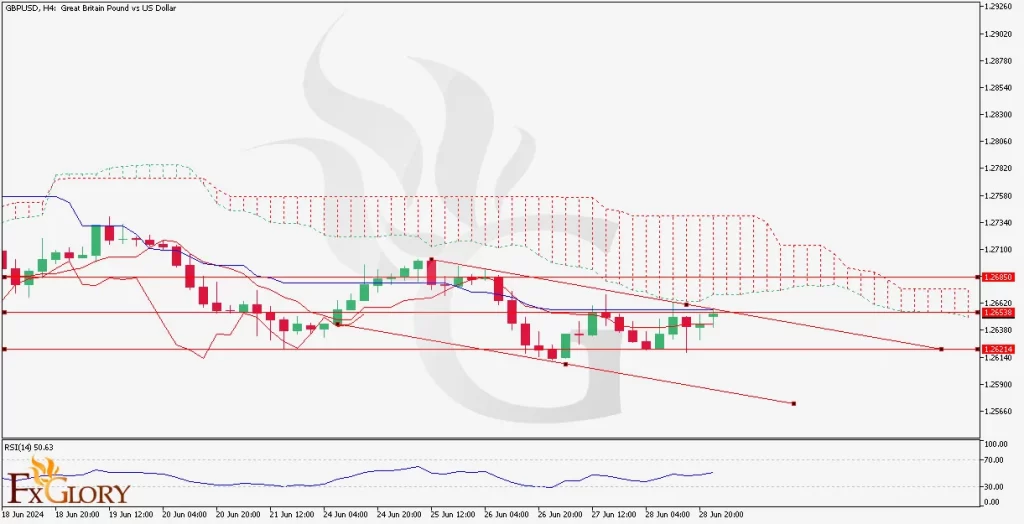
The GBP/USD H4 chart shows that the “Cable” has been in a bearish trend, evident from the price moving below the Ichimoku Cloud. The pair recently attempted a minor recovery but encountered strong resistance at key levels. The downward trendline in the pair’s technical analysis today further confirms bearish momentum, with lower highs and lower lows being formed.
Key Technical Indicators:
Ichimoku Cloud: The price is trading below the Ichimoku Cloud, indicating a prevailing bearish trend. The cloud itself acts as a significant resistance zone.
RSI (Relative Strength Index): The RSI is currently at 50.63, suggesting a neutral to slightly bearish momentum. It indicates that the market is not overbought or oversold, leaving room for potential downward movement.
Support and Resistance:
Support Levels: Immediate support is observed at 1.26314, followed by a stronger support level at 1.25670. These levels are crucial for maintaining the bearish structure.
Resistance Levels: The nearest resistance is at 1.26538, with a more significant resistance level at 1.26850. Breaking above these levels could signal a potential trend reversal.
Conclusion and Consideration:
The GBP/USD forecast today on the H4 chart continues to exhibit a bearish trend for the pair, with key indicators and price action supporting this outlook. Traders should monitor the support levels closely, as a break below 1.26314 could lead to further declines towards 1.25670. Conversely, a sustained break above 1.26538 may challenge the bearish trend, but significant resistance lies at 1.26850. The Cable’s fundamental factors of the day, such as economic data releases from both the UK and the US, will be crucial in determining the pair’s next move. Risk management strategies, including appropriate stop-loss levels, are essential given the current market volatility.
Disclaimer: The provided analysis is for informational purposes only and does not constitute investment advice. Traders should conduct their own research and analysis before making any trading decisions.