Economic calendar data is unavailable for this period, shifting market focus primarily toward technical price dynamics for the EUR/USD currency pair on the H4 timeframe.
Price Action:
On the H4 chart, EUR/USD experienced a strong advance from recent swing lows around 1.13648 to a peak high of 1.15359. Following a brief dip to 1.14543, price action bounced back to settle at a last close of 1.15162, maintaining a short-term bullish structure.
Key Technical Indicators:
Bollinger Bands(20,2.000): The Bollinger Bands display a middle line at 1.14494, an upper band at 1.15627, and a lower band at 1.13362. EUR/USD trading at 1.15162 positions the pair near the upper boundary, highlighting solid upward push relative to its 20-period moving average.
MACD(12,26,9): The MACD indicator is currently reading 0.003229, remaining in positive territory above the baseline to signify intact bullish momentum on the H4 timeframe.
RSI(14): The 14-period Relative Strength Index (RSI) stands at 64.51, signaling positive momentum in favor of buyers without entering deeply into overbought territory.
Support and Resistance:
Key technical levels for EUR/USD include primary resistance at 1.15359 and strong horizontal support established at 1.13524.
Conclusion and Consideration:
EUR/USD retains a bullish posture on the H4 chart, supported by a positive MACD and an RSI of 64.51. A continuation of current momentum could test resistance at 1.15359, whereas a pullback would bring focus toward the middle Bollinger Band near 1.14494 and primary support at 1.13524.
Disclaimer: The analysis provided for EUR/USD is for informational purposes only and does not constitute investment advice. Traders are encouraged to perform their own analysis and research before making any trading decisions. Market conditions can change quickly, so staying informed with the latest data is essential.
EUR/USD H4 Technical and Fundamental Analysis for 08.02.2026
The EURUSD H4 technical and fundamental analysis is expected to remain sensitive to Eurozone retail sales, manufacturing PMI data, ECB money supply, private loans, and unemployment figures, all of which can influence expectations for Eurozone economic strength. Stronger-than-expected EUR data could support the Euro by signaling healthier consumer spending, business activity, and credit growth. On the USD side, traders are monitoring remarks from Federal Reserve Governor Jerome Powell, S&P Global Manufacturing PMI, ISM Manufacturing PMI, ISM Prices Paid, and Construction Spending. Hawkish Fed commentary or stronger US manufacturing data could support the US Dollar and pressure the EURUSD price action. Overall, today’s EURUSD daily analysis and H4 forex forecast suggests that both European growth indicators and US monetary policy expectations may drive volatility.
Price Action:
The EURUSD H4 price action analysis shows that despite the candles falling with gradual speed, the lower levels of the chart are forming a classic bullish pennant-style structure. Price is now moving closer to the tip of the triangle, where the rising support line and descending resistance line are narrowing the trading range. This compression suggests that the market is preparing for a stronger directional breakout after the current consolidation phase. Given the bullish pennant formation and the recent respect of the ascending support line, a future breakout above the descending resistance line remains possible. However, confirmation is needed before the EURUSD H4 chart analysis shifts decisively toward bullish continuation.
Key Technical Indicators:
Bollinger Bands (95): The candles are positioned near the middle line of the Bollinger Bands, showing balanced short-term momentum. The narrowing bands suggest lower volatility and indicate that a breakout phase may be developing.
RSI (14): The RSI currently stands at 54.87, slightly above the neutral 50 level. This reflects mild bullish momentum, but not enough to confirm a strong breakout without further price confirmation.
MACD (12,26,9): The MACD values at 0.000672 and 0.000368 indicate that bullish momentum is currently present. The positive MACD structure supports the possibility of an upside breakout if price clears the descending resistance line.
Support and Resistance:
Support: The nearest support level is located around 1.15890, aligning with the rising support line that forms the lower boundary of the bullish pennant pattern.
Resistance: The closest resistance zone appears near 1.17300, matching the descending trendline that must be broken to confirm bullish continuation.
Conclusion and Consideration:
The current EURUSD H4 technical analysis and price action forecast suggests that the pair is consolidating inside a narrowing bullish pennant structure after a gradual bearish movement. Technical indicators such as the RSI and MACD support mild bullish momentum, while the narrowing Bollinger Bands indicate that volatility may expand soon. A confirmed breakout above the descending resistance line could strengthen the bullish scenario and support a continuation move in the EURUSD H4 forex outlook. Fundamentally, Eurozone PMI, retail sales, ECB monetary data, and US manufacturing or Fed-related developments may act as catalysts for the next major move. Traders should watch the pennant boundaries closely, as a breakout from either side may define the next short-term direction.
Disclaimer: The analysis provided for EUR/USD is for informational purposes only and does not constitute investment advice. Traders are encouraged to perform their own analysis and research before making any trading decisions on EURUSD. Market conditions can change quickly, so staying informed with the latest data is essential.
The EUR/USD currency pair reflects the exchange rate between the Euro and the US Dollar, and today’s EURUSD H4 daily technical and fundamental analysis is likely to be influenced mainly by USD-side economic data and geopolitical headlines. The US calendar includes the FHFA House Price Index, S&P/Case-Shiller House Price Index, and CB Consumer Confidence, all of which can affect the USD outlook because housing prices and consumer sentiment are key indicators of economic strength and future spending. A stronger-than-forecast reading may support the US Dollar and pressure EURUSD lower, while weaker data could help the Euro recover against the Dollar. In addition, Iran-related geopolitical updates and Hormuz headlines may affect broader market sentiment, risk appetite, energy prices, and safe-haven USD demand, making today’s EUR/USD H4 chart analysis sensitive to both macroeconomic news and headline-driven volatility.
Price Action:
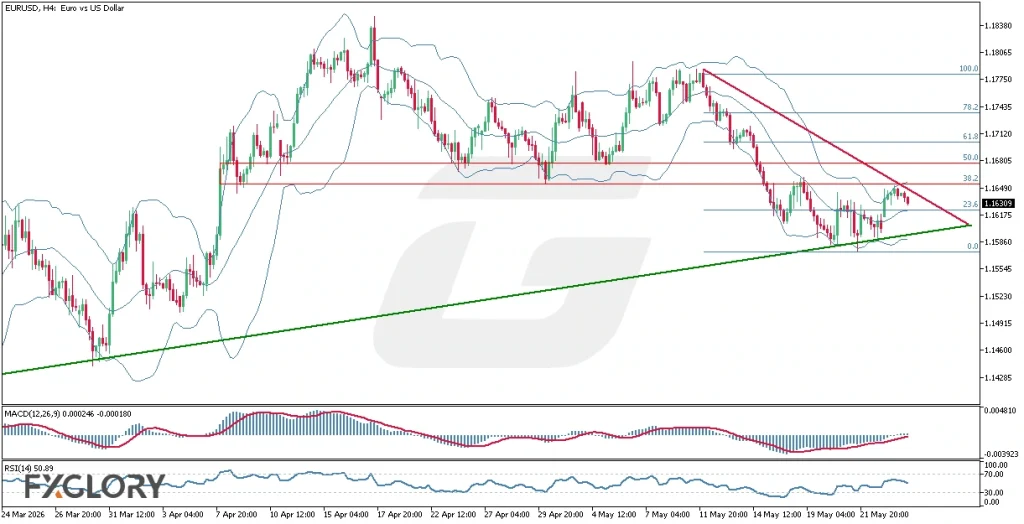
The EURUSD pair analysis on the H4 timeframe shows price moving inside a tightening triangle pattern, formed between the descending red resistance trendline and the rising green support trendline. After the recent bearish drop from the May highs, EUR/USD found buyers near the green trendline and the 0.0 Fibonacci retracement area around 1.1580, creating a short-term rebound. However, the price is now hesitating near the 23.6% Fibonacci level and the 1.1630–1.1645 zone, where small-bodied candles and upper wicks indicate weak bullish conviction and possible rejection. The red horizontal resistance area around 1.1650–1.1680 remains a key supply zone, and the next major EURUSD H4 price action signal will likely come from a breakout above the red trendline or a rejection back toward the green support.
Key Technical Indicators:
Bollinger Bands: The EURUSD H4 Bollinger Bands are narrowing, signaling low volatility and a possible breakout ahead. Price is near the middle band, showing consolidation between the triangle support and resistance.
MACD (Moving Average Convergence Divergence): The MACD is recovering from bearish territory, with momentum gradually improving. However, it remains close to neutral, so a stronger bullish crossover is needed to confirm upside continuation.
RSI (Relative Strength Index): The RSI is near 50, indicating neutral momentum in the EUR/USD H4 price action analysis. A move above 55 would support buyers, while a drop below 45 could favor sellers.
Support and Resistance:
Support: Immediate support is located around 1.1600–1.1580, aligning with the rising green trendline, the lower Bollinger Band area, and the recent swing low.
Resistance: Key resistance is positioned around 1.1650–1.1680, where the red horizontal zone, descending red trendline, and Fibonacci retracement levels create a strong technical barrier.
Conclusion and Consideration:
The EUR-USD H4 technical and fundamental chart daily analysis suggests that the pair is consolidating inside a tightening triangle after a recent bearish move, with price trapped between rising support and descending resistance. The Bollinger Bands indicate low volatility before a potential breakout, the MACD is showing early recovery, and the RSI remains neutral near 50, confirming that the market is waiting for a stronger catalyst. A confirmed breakout above the red descending trendline and the 1.1650–1.1680 resistance zone could support a bullish EUR/USD H4 forecast toward the 38.2%, 50.0%, and 61.8% Fibonacci levels. On the other hand, rejection from resistance combined with stronger USD news could push EURUSD back toward 1.1600–1.1580, where the next bearish or bullish reaction should be closely monitored.
Disclaimer: The analysis provided for EUR/USD is for informational purposes only and does not constitute investment advice. Traders are encouraged to perform their own analysis and research before making any trading decisions on EURUSD. Market conditions can change quickly, so staying informed with the latest data is essential.
The EUR/USD currency pair is likely to remain sensitive to both USD and EUR fundamental drivers in today’s forex market analysis. For the US Dollar, traders will monitor Federal Reserve Governor Michael Barr’s speech, as any hawkish comments regarding inflation, interest rates, or monetary policy could support the USD and pressure EURUSD lower. In addition, the New York Manufacturing Index, Capacity Utilization Rate, and Industrial Production data may influence short-term USD volatility; stronger-than-expected figures would generally be positive for the US Dollar. On the Euro side, the ECB Economic Bulletin will be watched for insight into the European Central Bank’s economic outlook, inflation expectations, and future policy direction, making today’s EUR-USD H4 technical and fundamental analysis important for intraday and swing traders.
Price Action:
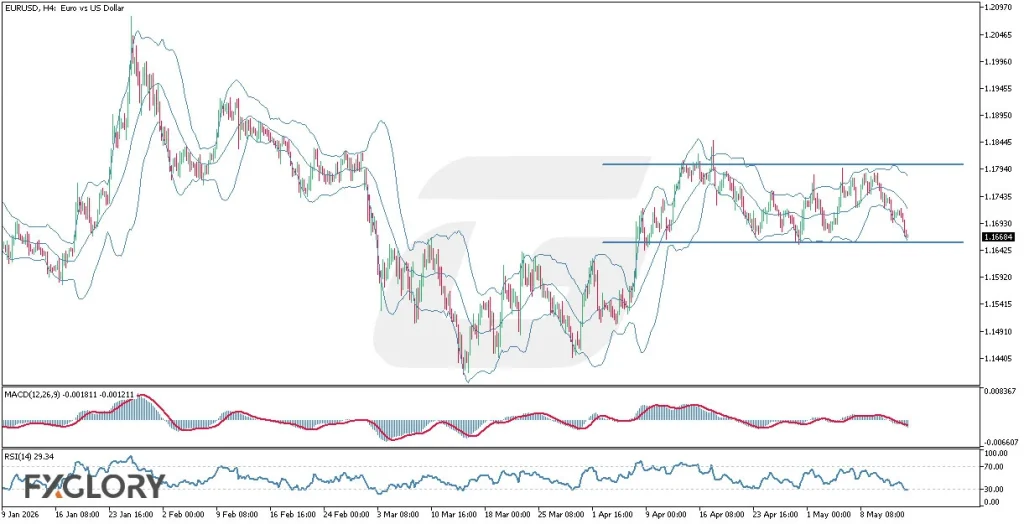
The EUR/USD price action on the H4 chart remains under short-term bearish pressure after the pair rejected the resistance zone near 1.1800 and moved back toward the key support area around 1.1665. The recent candles show weakening bullish momentum, with sellers regaining control after repeated failures to break above the upper horizontal resistance. Price is currently trading close to the lower side of the consolidation range, suggesting that a breakdown below support could extend the bearish EUR-USD H4 forecast. However, because the pair is approaching an oversold area, a temporary corrective bounce may appear if buyers defend the current support zone.
Key Technical Indicators:
Bollinger Bands (20,2.000): The Bollinger Bands on the EURUSD H4 chart show price trading near the lower band, confirming that bearish pressure has increased in the short term. The bands are slightly expanding, which indicates rising volatility after the recent rejection from the resistance zone. As long as price remains below the middle Bollinger Band, the EUR/USD technical analysis outlook favors sellers, although a short-term rebound from the lower band remains possible.
MACD (12,26,9): The MACD indicator remains below the signal line, showing that bearish momentum is still active on the EURUSD H4 timeframe. The histogram reflects weakening upside pressure and supports the current downside move toward support. Unless the MACD line begins to flatten and cross back above the signal line, the EUR/USD price action outlook remains vulnerable to further selling.
RSI (14): The RSI is near 29, placing EUR-USD close to oversold territory on the H4 chart. This confirms strong short-term selling pressure but also warns traders that the pair may be vulnerable to a corrective bounce if support holds. A recovery above the 30–35 area would suggest improving momentum, while continued weakness below 30 could confirm bearish continuation in the EUR/USD daily technical analysis.
Support and Resistance:
Support: Immediate support is located around 1.1665, which aligns with the lower horizontal range boundary and the current price reaction area. A confirmed H4 candle close below this zone could open the way for deeper bearish continuation.
Resistance: Key resistance is positioned near 1.1800, where the pair has repeatedly failed to break higher. A strong move above this level would weaken the bearish scenario and support a potential bullish recovery.
Conclusion and Consideration:
The EURUSD H4 technical and fundamental chart daily analysis suggests that the pair remains in a short-term bearish structure, with price trading near key support after rejecting the 1.1800 resistance zone. Bollinger Bands, MACD, and RSI all support the current bearish EUR/USD forecast, although oversold RSI conditions may trigger a temporary rebound if buyers defend the 1.1665 support area. Traders should closely monitor today’s USD news, especially Fed Governor Michael Barr’s remarks and US manufacturing-related data, as hawkish commentary or stronger US figures could strengthen the Dollar and increase downside pressure on EUR/USD. On the other hand, any dovish Fed tone or supportive ECB signals could help EURUSD stabilize and attempt a recovery within the H4 trading range.
Disclaimer: The analysis provided for EUR/USD is for informational purposes only and does not constitute investment advice. Traders are encouraged to perform their own analysis and research before making any trading decisions on EURUSD. Market conditions can change quickly, so staying informed with the latest data is essential.
The EURUSD H4 technical and fundamental analysis for today is influenced by near-term Eurozone PMI updates, Sentix Investor Confidence, Eurogroup developments, and ECB-related commentary. For the Euro, stronger-than-expected Manufacturing PMI or investor confidence data could support EUR sentiment by signaling improving business conditions across the Eurozone. Comments from ECB officials may also create volatility if they provide clues about future monetary policy. For the USD, Factory Orders, Federal Reserve commentary, and credit-related updates remain important for assessing US economic strength and Fed policy expectations. Overall, today’s EURUSD daily analysis suggests that fundamental volatility may increase if European data or Fed remarks shift market expectations.
Price Action:
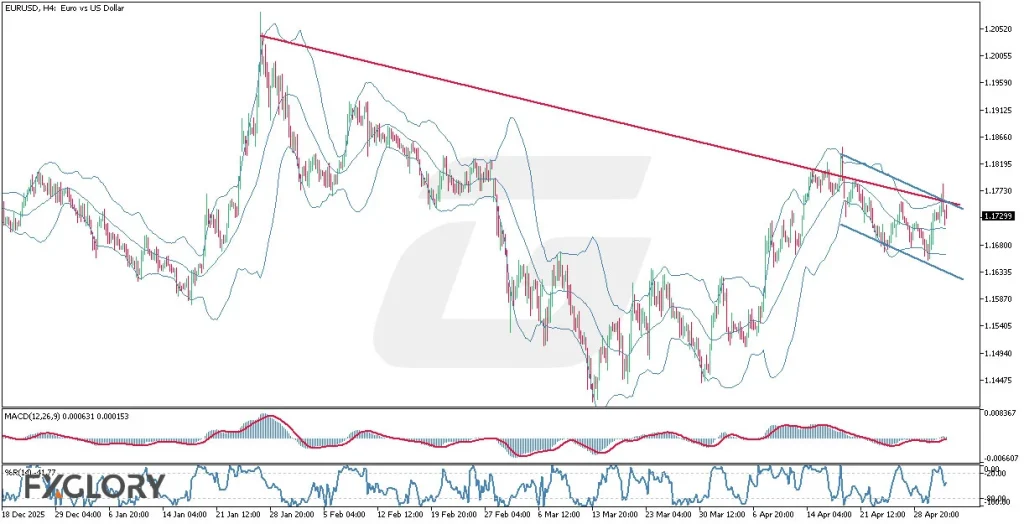
The EURUSD H4 price action analysis shows that the pair is still trading under a broader descending resistance line, while the recent candles are also moving inside a smaller bearish channel. Despite the previous bullish correction, the candles have failed to establish a clear breakout above the upper trendline, keeping sellers active near resistance. The latest candles show hesitation around the channel’s upper boundary, suggesting that buyers are attempting recovery but have not yet confirmed control. If the price remains below this resistance area, the market may continue moving toward the lower side of the bearish channel. In this EURUSD H4 forecast, a confirmed breakout above the descending lines would be needed to weaken the bearish outlook.
Key Technical Indicators:
Bollinger Bands (25): The Bollinger Bands have slightly expanded, showing rising volatility. Price remains vulnerable to another downside move if it fails to hold above the middle band.
MACD (12,26,9): The MACD values at 0.000631 and 0.000153 show that bullish momentum is still present. However, the momentum remains limited while price stays below the descending resistance structure.
Williams %R (14): The Williams %R at -41.77 reflects neutral market momentum. This shows that the pair is not overbought or oversold, supporting the current indecisive EURUSD price action.
Support and Resistance:
Support: The nearest support is aligned with the lower boundary of the bearish channel, which remains the next downside target if selling pressure continues.
Resistance: The key resistance is located near the upper boundary of the bearish channel, where recent candles have struggled to sustain bullish movement.
Conclusion and Consideration:
The EURUSD H4 chart daily analysis continues to show bearish pressure, even though the pair previously attempted a bullish correction. Current EURUSD price action remains contained inside a descending channel, and the upper channel boundary is acting as an important resistance zone. Technical indicators show some short-term bullish attempts, but they are not strong enough yet to invalidate the bearish structure. Fundamentally, Eurozone PMI-related updates, investor sentiment, ECB commentary, and US data may influence volatility during today’s session. A clear breakout above the channel would weaken the bearish outlook, while rejection from resistance may support continuation toward the lower channel boundary.
Disclaimer: The analysis provided for EUR/USD is for informational purposes only and does not constitute investment advice. Traders are encouraged to perform their own analysis and research before making any trading decisions on EURUSD. Market conditions can change quickly, so staying informed with the latest data is essential.