Time Zone: GMT +3
Time Frame: 4 Hours (H4)
Fundamental Analysis:
The USDJPY currency pair reflects the exchange rate between the US Dollar (USD) and the Japanese Yen (JPY). Today’s upcoming USD news includes several low to medium impact events such as speeches by FOMC members and data on Personal Income and Spending. Notably, the Core PCE Price Index, forecasted at 0.1%, is a crucial inflation measure for the Fed. These indicators may provide insights into future US monetary policy, potentially influencing USD volatility. For JPY, the medium impact Tokyo Core CPI is forecasted at 2.0%, and other low impact data such as Unemployment Rate, Industrial Production, and Housing Starts are expected, which could affect the JPY’s performance.
Price Action:
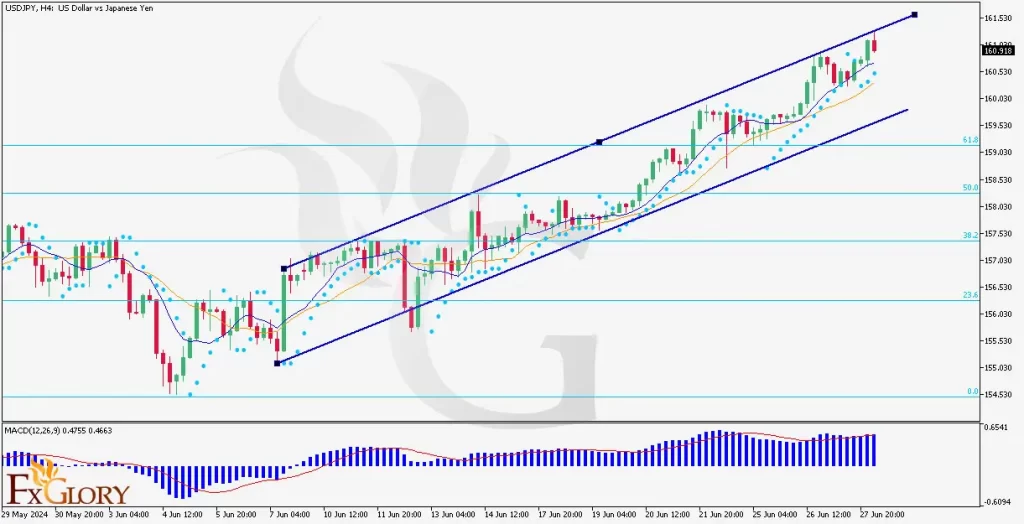
The USDJPY pair on the H4 timeframe is experiencing a clear bullish trend, with the price reaching its highest level since 2010. The price action shows a consistent upward movement as the candles move from the lower to the middle and now the upper Bollinger Bands, indicating strong bullish momentum. Recently, the price has been moving upwards steadily, supported by a positive trend in the market.
Key Technical Indicators:
Parabolic SAR: The Parabolic SAR indicator shows the last three dots positioned below the candles, confirming a bullish trend. This placement indicates continued upward momentum, suggesting traders might look for buy opportunities as long as the dots remain under the price.
MACD: The MACD indicator shows the MACD line crossing above the signal line with the histogram displaying increasing momentum. This bullish crossover suggests strengthening upward momentum, which supports the ongoing bullish trend in the USDJPY pair.
Moving Averages: The short-term Moving Average (9-period, blue) has crossed above the long-term Moving Average (17-period, orange), both moving upwards. This crossover is a bullish signal, indicating that the short-term price trend is gaining strength relative to the long-term trend.
Support and Resistance:
Support: Immediate support is located at 1.36600, aligning with a recent consolidation area and the middle Bollinger Band.
Resistance: The nearest resistance level is at 1.37481, which coincides with the 0.382 Fibonacci level and recent highs.
conclusion and Consideration:
The USDJPY pair on the H4 chart shows sustained bullish momentum, supported by the Parabolic SAR, MACD, and Moving Averages indicators. The current price action within an ascending channel indicates that the bulls are in control, with potential further gains as indicated by the key technical indicators. However, traders should remain cautious due to potential increased volatility from the upcoming economic data releases and speeches from key officials. It is essential to monitor these events closely as they could significantly impact market conditions.
Disclaimer: The provided analysis of USDJPY is for informational purposes only and does not constitute investment advice. Traders should conduct their own research and analysis before making any trading decisions. Market conditions can change rapidly, and staying updated with the latest information is crucial for informed trading decisions.