Time Zone: GMT +3
Time Frame: 4 Hours (H4)
Fundamental Analysis:
The AUD/CAD forex pair, representing the exchange rate between the Australian Dollar and the Canadian Dollar, is currently subject to several significant economic events. Recent fluctuations in global commodity prices, particularly those affecting Australia’s primary exports, alongside economic indicators from both countries, have contributed to the volatility observed in this pair.
Price Action:
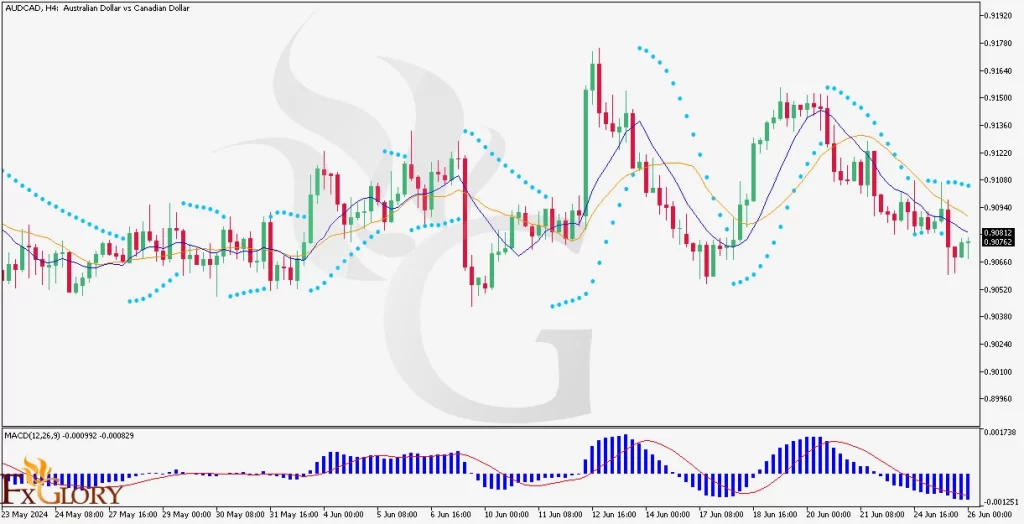
Analyzing the AUDCAD H4 chart, the pair shows a mixed trend with periods of volatility influenced by external economic factors. The price has been fluctuating within a range, indicating uncertainty among traders regarding the future direction.
Key Technical Indicators:
Bollinger Bands: The current position within the Bollinger Bands indicates that the market is potentially overbought. Prices nearing the upper band suggest that a pullback might be due. This is a signal for traders to consider taking profits on long positions as a correction could be imminent.
MACD: The MACD line is hovering around the histogram bar, suggesting potential bearish momentum if it moves below the signal line. This position is a typical bearish signal, indicating that traders might consider short positions or exercise caution with long positions.
Support and Resistance Levels:
Support: The immediate support level is around 0.9040. A break below this level could lead the pair to test the next support at 0.9000.
Resistance: The nearest resistance is at 0.9100, followed by a stronger resistance level at 0.9140.
Conclusion and Consideration:
The AUDCAD pair on the H4 chart displays mixed signals with a bearish inclination suggested by the MACD and Parabolic SAR indicators. The Bollinger Bands indicate an overbought condition, hinting at a potential correction. Traders should monitor these levels closely and watch for any fundamental news that might impact the pair, such as changes in commodity prices or economic data releases from Australia and Canada.
Disclaimer: The analysis provided is for informational purposes only and does not constitute investment advice. Traders should conduct their own research and analysis before making any trading decisions. Market conditions can change rapidly, and it is essential to stay updated with the latest information.
FXGlory
26.06.2024