Time Zone: GMT +3
Time Frame: 4 Hours (H4)
Fundamental Analysis:
The USD/CAD forex pair, representing the exchange rate between the US Dollar and the Canadian Dollar, is set to react to several key economic events today. At 1:30 pm, multiple CPI metrics for Canada are scheduled to be released, including the CPI m/m, Median CPI y/y, Trimmed CPI y/y, Common CPI y/y, and Core CPI m/m. The forecast for the CPI m/m is 0.3%, down from the previous 0.5%, while the Core CPI m/m forecast is 0.2%, slightly lower than the previous 0.5%. Any deviations from these forecasts could result in significant volatility for the CAD. A higher-than-expected CPI could strengthen the CAD as it may increase the likelihood of the Bank of Canada adopting a more hawkish stance. Conversely, lower-than-expected CPI readings could weaken the CAD.
Price Action:
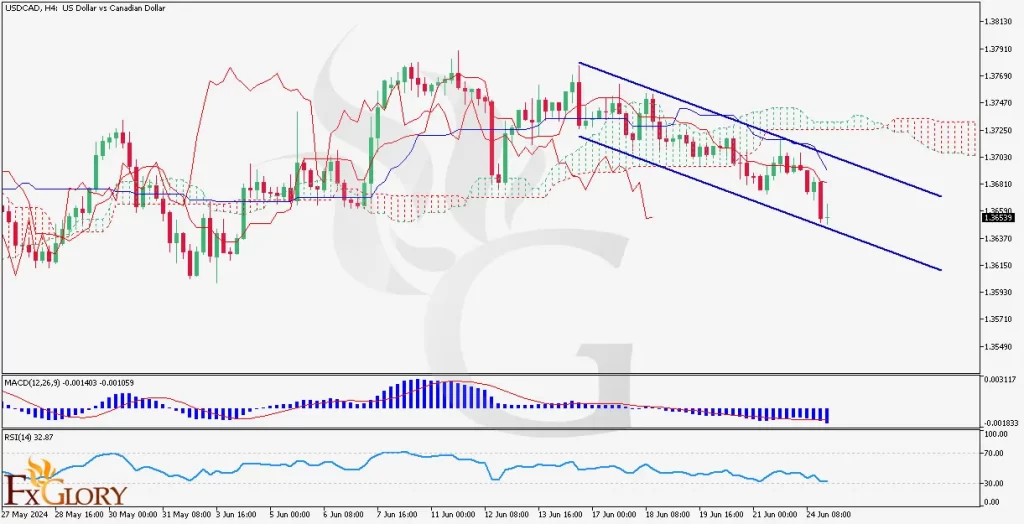
Analyzing the USD/CAD H4 chart, the pair has been in a clear downtrend, characterized by lower highs and lower lows. The USD/CAD price has been moving within a descending channel, indicating sustained bearish momentum. Recently, the price has broken below the Ichimoku Cloud and is now trading near the lower boundary of the channel, indicating strong bearish sentiment.
Key Technical Indicators:
Ichimoku Cloud: USDCAD price is trading below the Ichimoku Cloud, indicating a strong bearish trend for this pair. The cloud itself is bearish, with the future cloud showing red, which suggests continued downward pressure. The Tenkan-sen and Kijun-sen lines are also indicating bearish momentum as they are positioned below the cloud.
MACD: The MACD line is below the signal line, and the histogram is in negative territory, which confirms the bearish trend on exchange rate between these currencies. The MACD indicator suggests that selling pressure is still dominant, and there are no immediate signs of a bullish reversal.
RSI: The RSI is currently at 32.87, indicating bearish momentum and that the pair is approaching oversold conditions. This suggests that while the bearish trend is strong, there might be a potential for a short-term corrective bounce.
Support and Resistance:
Support Levels: Immediate support is found at 1.36400. A break below this level could see the pair heading towards the next support at 1.3600.
Resistance Levels: The nearest resistance level is at 1.36730. Above this, resistance is found at 1.36880.
Conclusion and Consideration:
The USD/CAD pair on the H4 chart shows strong bearish momentum, supported by the Ichimoku Cloud, MACD, and RSI indicators. Traders should watch for potential volatility around the release of the Canadian CPI data. While the overall trend is bearish, the RSI suggests that the pair might be due for a short-term bounce from oversold conditions. Caution is advised as fundamental news could lead to sharp movements.
Disclaimer: The provided analysis is for informational purposes only and does not constitute investment advice. Traders should conduct their own research and analysis before making any trading decisions.