Time Zone: GMT +3
Time Frame: 4 Hours (H4)
Fundamental Analysis:
The EUR/USD pair, representing the exchange rate between the Euro and the US Dollar, is set to react to several key economic events today. FOMC members Mary Daly and Christopher Waller are scheduled to speak, and their remarks may provide insights into future US monetary policy. A hawkish tone could strengthen the USD. On the Euro side, German Buba President Joachim Nagel and the German ifo Business Climate report are due. Positive comments from Nagel or a better-than-expected ifo Business Climate could support the Euro. Additionally, the Belgian NBB Business Climate report will also be released, although its impact is expected to be minimal compared to the German data.
Price Action:
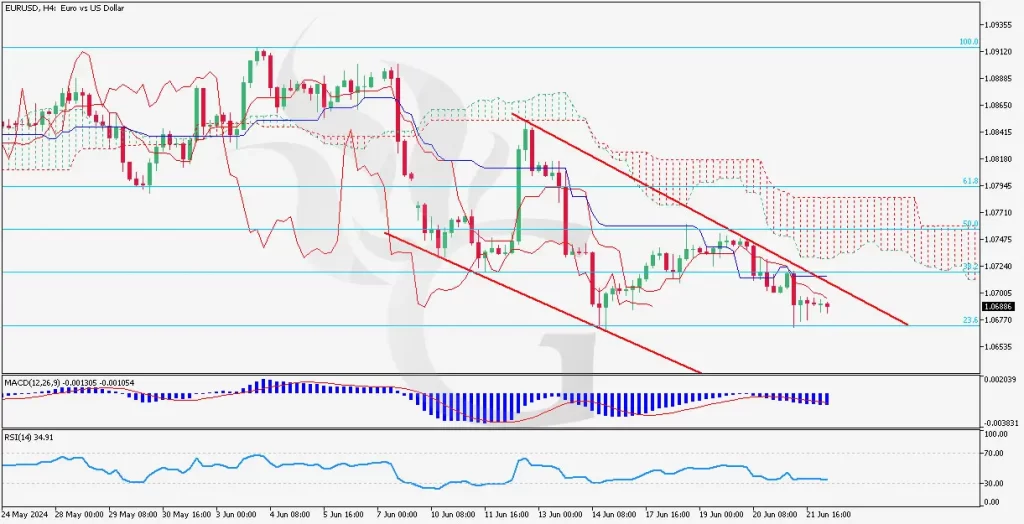
Analyzing the EUR/USD H4 chart, the pair has been in a clear downtrend, characterized by lower highs and lower lows. The price has been moving within a descending channel, indicating sustained bearish momentum. Recently, the price has tested the lower boundary of the channel and is now hovering around a support area. The candles show a mix of bearish and brief bullish attempts, but the overall trend remains bearish.
Key Technical Indicators:
Ichimoku Cloud: The price is trading below the Ichimoku Cloud, indicating a strong bearish trend. The cloud itself is bearish, with the future cloud showing red, which suggests continued downward pressure. The Tenkan-sen and Kijun-sen lines are also indicating bearish momentum as they are positioned below the cloud.
MACD: The MACD line is below the signal line, and the histogram is in negative territory, which confirms the bearish trend. The MACD indicator suggests that selling pressure is still dominant, and there are no immediate signs of a bullish reversal.
RSI: The RSI is currently at 34.91, indicating bearish momentum and that the pair is approaching oversold conditions. This suggests that while the bearish trend is strong, there might be a potential for a short-term corrective bounce.
Support and Resistance Levels:
Support: Immediate support is found at 1.0667, corresponding to the 23.6% Fibonacci retracement level. A break below this level could see the pair heading towards the next support at 1.0635.
Resistance: The nearest resistance level is at 1.0724, which aligns with the 38.2% Fibonacci retracement level and the upper boundary of the descending channel. Above this, resistance is found at 1.0745, near the 50% Fibonacci retracement level.
Conclusion and Consideration:
The EUR/USD pair on the H4 chart shows strong bearish momentum, supported by the Ichimoku Cloud, MACD, and RSI indicators. Traders should watch for potential volatility around the speeches of FOMC members and the German ifo Business Climate report. While the overall trend is bearish, the RSI suggests that the pair might be due for a short-term bounce from oversold conditions. Caution is advised as fundamental news could lead to sharp movements.
Disclaimer: The analysis provided is for informational purposes only and does not constitute investment advice. Traders should conduct their own research and analysis before making any trading decisions. Market conditions can change rapidly, and it is essential to stay updated with the latest information.