Time Zone: GMT +3
Time Frame: 4 Hours (H4)
Fundamental Analysis:
The EUR/USD news analysis today is influenced by various macroeconomic factors and central bank policies. Currently, the European Central Bank (ECB) is considering interest rate adjustments, with potential cuts on the horizon due to concerns about economic growth. On the other hand, the Federal Reserve (FOMC) is tackling inflation, with recent retail sales data indicating a potential increase. These diverging paths are crucial in understanding the EUR/USD dynamics. The ECB’s dovish stance may weaken the euro, while positive U.S. economic data could strengthen the dollar.
Price Action:
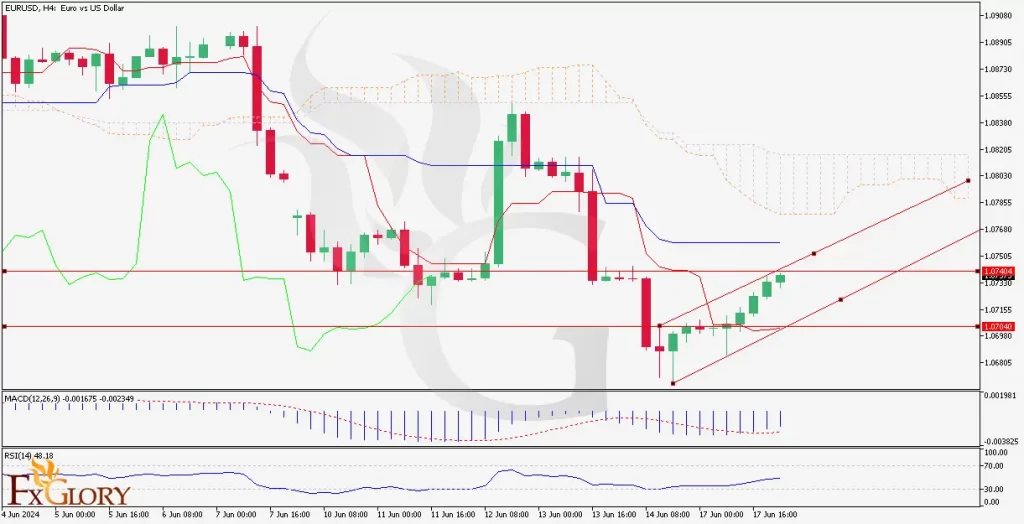
The EUR/USD H4 chart indicates that the price is recovering from a recent downtrend. The price action shows higher highs and higher lows, suggesting a bullish reversal. The EURUSD technical analysis today shows the pair is currently trading within an ascending channel, with immediate resistance around 1.0745 and support at 1.0700. The recent bullish candles indicate strong buying pressure, but traders should be cautious of potential resistance levels.
Key Technical Indicators:
Ichimoku Cloud: The price is below the Ichimoku Cloud, indicating a bearish sentiment. However, the recent upward movement suggests a potential challenge to the cloud’s lower boundary.
MACD (Moving Average Convergence Divergence): The MACD line is below the signal line, and the histogram shows negative values, indicating bearish momentum. However, the convergence of the lines suggests a possible bullish crossover.
RSI (Relative Strength Index): The RSI is around 48.18, which is neutral. It indicates that the market is not yet overbought or oversold, providing room for further price movement.
Support and Resistance:
Support Levels: Immediate support is at 1.0700, which aligns with the lower boundary of the ascending channel. Additional support is found at 1.0680.
Resistance Levels: Immediate resistance is at 1.0745, followed by the upper boundary of the ascending channel. Further resistance can be seen at 1.0785, near the Ichimoku Cloud.
Conclusion and Consideration:
The EUR/USD forecast live is showing signs of a potential bullish reversal on the H4 timeframe, supported by higher lows and higher highs within an ascending channel. Traders should monitor the key resistance levels at 1.0745 and 1.0785 for a potential breakout. The RSI and MACD indicators suggest that the market is in a neutral to slightly bearish phase, but the convergence in MACD hints at possible bullish momentum. Fundamental factors, such as ECB and FOMC policies, will continue to play a significant role in the pair’s movement. Traders should implement risk management strategies, considering the volatile nature of the forex market.
Disclaimer: The provided analysis is for informational purposes only and does not constitute investment advice. Traders should conduct their own research and analysis before making any trading decisions.