Time Zone: GMT +3
Time Frame: 4 Hours (H4)
Fundamental Analysis:
USDCAD is influenced by several economic factors from both the US and Canada. For the USDCAD news forecast today, the focus is on the Empire State Manufacturing Index from the US, which is forecasted to be -12.5. This high-impact data could significantly affect the US Dollar if the actual figure deviates from expectations, indicating either a strengthening or weakening of the manufacturing sector in New York. On the Canadian side, Housing Starts are forecasted at 247K and Foreign Securities Purchases at 12.30B. Both these low-impact data points provide insights into Canada’s economic health, with better-than-expected figures potentially strengthening the CAD. Monitoring the USDCAD news analysis today live is crucial for understanding the impact of these data releases.
Price Action:
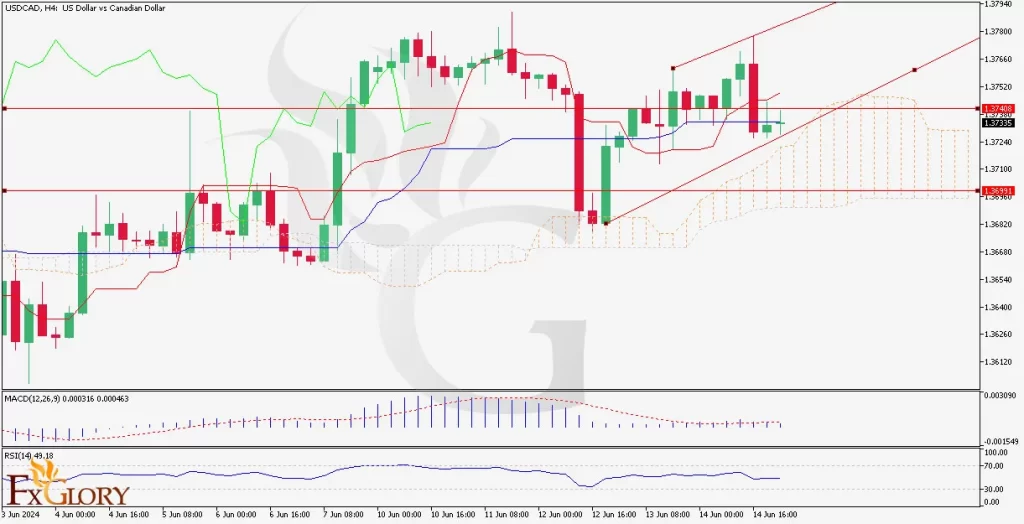
The H4 chart for USDCAD indicates a recent period of volatility with significant price swings. The technical analysis today, shows the pair has been moving within an ascending channel, suggesting an overall bullish trend. However, recent candles show mixed sentiment with both bullish and bearish pressures evident. The price is currently above the Ichimoku cloud, indicating potential support, while resistance levels are being tested frequently.
Key Technical Indicators:
Ichimoku Cloud: The price is trading above the Ichimoku cloud, suggesting a bullish sentiment. The cloud’s future projection is flat, indicating potential consolidation or a slowdown in the upward momentum.
MACD (Moving Average Convergence Divergence): The MACD histogram is slightly positive, with the MACD line crossing above the signal line, indicating a bullish momentum. However, the difference between the two lines is minimal, suggesting cautious optimism.
RSI (Relative Strength Index): The RSI is at 49.18, close to the neutral 50 level, indicating neither overbought nor oversold conditions. This suggests that the market could move in either direction depending on upcoming data releases or market sentiment.
Support and Resistance:
Support Levels: Immediate support is at 1.36991, aligned with the lower boundary of the ascending channel and Ichimoku cloud.
Resistance Levels: The resistance is observed at 1.37408, which coincides with recent highs and the upper boundary of the channel.
Conclusion and Consideration:
The USDCAD pair on the H4 chart presents a cautious bullish outlook with key support and resistance levels closely watched. The indicators suggest a potential continuation of the upward trend, provided the price remains above the Ichimoku cloud and the MACD stays positive. Traders should monitor today’s economic releases, particularly the Empire State Manufacturing Index, for cues on market direction. Appropriate risk management, including setting stop-loss levels near support at 1.36991, is advised given the potential volatility from the upcoming data.
Disclaimer: The provided analysis is for informational purposes only and does not constitute investment advice. Traders should conduct their own research and analysis before making any trading decisions.


