Time Zone: GMT +3
Time Frame: 4 Hours (H4)
Fundamental Analysis:
The recent news includes key economic indicators from the US that could significantly affect the possible future direction on GBP/USD exchange rate. On June 12th, critical data releases include the Core CPI m/m with a forecast of 0.3% against the previous 0.3%, and the CPI m/m expected at 0.1% compared to the previous 0.3%. The year-over-year CPI is anticipated to be 3.4%, matching the previous figure. Additionally, at 7:00 pm, the Federal Funds Rate is expected to remain at 5.50%, accompanied by the FOMC Economic Projections, FOMC Statement, and the Federal Budget Balance, forecasted at -279.6B against the previous 209.5B. These economic indicators are essential to watch as they provide insights into the economic health of the US, influencing the strength of the USD and, consequently, the GBP/USD currency pair.
Price Action:
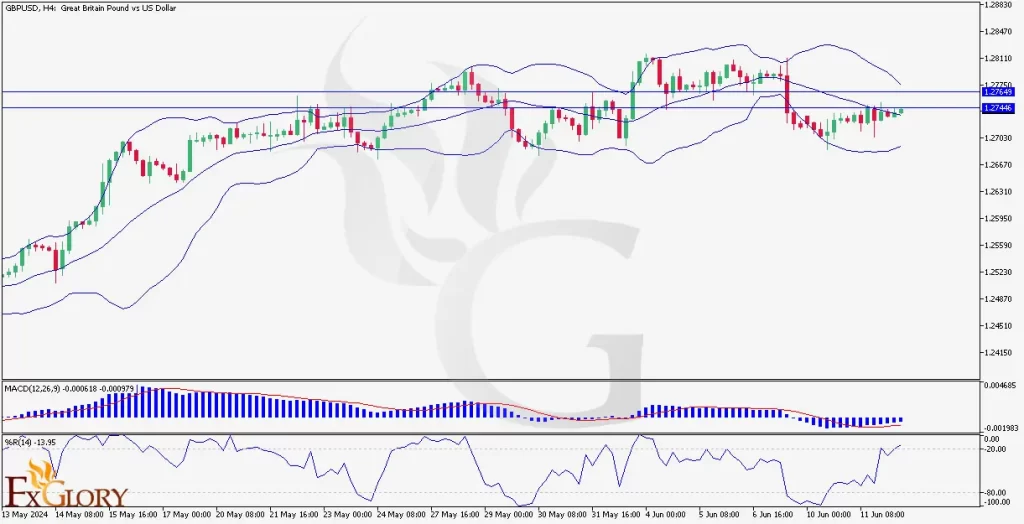
The GBP/USD H4 chart currently shows that the price is testing a significant resistance level. GBPUSD candlestick formations around this resistance zone indicate a potential weakness in the bearish momentum on this pair’s price movement, suggesting a possible reversal or consolidation. Traders should watch for confirmation of this resistance holding or breaking to determine the next directional move.
Key Technical Indicators:
Williams R%: The Williams % Range on GBPUSD is currently showing bearish conditions, hovering in the oversold territory. This suggests that the pair might be due for a pullback or consolidation before any further bearish movement.
MACD: The Moving Average Convergence Divergence (MACD) on this forex pair shows bearish signals with the histogram below the zero line and the MACD line below the signal line, indicating ongoing bearish momentum.
Support and Resistance:
Support Levels: The lower points of the recent candles around 1.27650 serve as the immediate support level.
Resistance Levels: The upper line of the former bearish channel around 1.26870 acts as a resistance level.
Conclusion and Consideration:
Traders should closely monitor both the upcoming economic news and the GBP/USD reaction at the 1.27640 resistance level. A failure to break through could confirm the bearish price prediction, leading to potential short opportunities. Conversely, a strong push above this level could invalidate the bearish scenario for this pair. Given these dynamics, it’s essential to stay updated with the latest economic reports and adjust strategies accordingly to navigate the volatile forex market effectively.
Disclaimer: The provided analysis is for informational purposes only and does not constitute investment advice. Traders should conduct their own research and analysis before making any trading decisions.