
USDJPY Forecast

USD iconJPY icon
USD/JPY

US Dollar vs Japanese Yen

USD/JPY Live Price

156.71600
+0.44%

USD/JPY Forecast — 12 September 2026

Time Zone: GMT +3

Time Frame: Daily (D1) / Weekly Outlook

Weekly Fundamental Overview:

The USD/JPY currency pair faces heightened volatility as market participants evaluate shifting monetary policy expectations between the Federal Reserve and the Bank of Japan. Domestic retail metrics and central bank communications are set to play a pivotal role in dictating capital flows. Differences in interest rate outlooks remain a primary driver, with traders closely monitoring rate announcements and macroeconomic releases for indications of future policy trajectories.

Price Action:

On the daily (D1) timeframe, USD/JPY experienced a notable decline from recent highs near 160.16 down toward the 152.93 area before staging a slight recovery to close at 154.418. The price action demonstrates significant downward momentum over recent sessions, leaving the pair trading closer to its lower boundary within the broader structure.

Key Technical Indicators:

Bollinger Bands: The Bollinger Bands indicator highlights a middle band at 157.919, an upper band at 162.326, and a lower band at 153.513. The current close of 154.418 places USD/JPY near the lower band, reflecting extended selling pressure and elevated daily volatility.

RSI: The 14-period Relative Strength Index (RSI) stands at 31.419. This reading places the pair near oversold conditions, signaling strong selling intensity while suggesting potential for consolidation if buying interest emerges.

MACD: The MACD indicator registers a reading of -1.485, remaining negative beneath the signal line. This negative value underscores prevailing bearish momentum on the daily chart.

Support and Resistance:

Key technical boundaries for USD/JPY include primary support at 152.878 and key resistance at 163.973. Intermediate resistance is also marked by the middle Bollinger Band at 157.919.

News to Watch for USDJPY This Week:

  • Core Retail Sales m/m: This release measures changes in consumer spending that can influence US economic growth expectations.
  • Retail Sales m/m: Broad retail data provides insight into domestic demand and overall economic momentum.
  • FOMC Economic Projections: Central bank forecasts provide vital clues regarding future interest rate paths and economic conditions.
  • FOMC Statement: Official policy commentary clarifies the central bank's stance on monetary policy.
  • Federal Funds Rate: The policy rate benchmark directly drives exchange rate valuations and yield dynamics.
  • FOMC Press Conference: Leadership remarks provide further context on monetary policy decisions and economic risks.
  • Unemployment Claims: Weekly labor data offers insight into overall employment market health.
  • Monetary Policy Statement: Official policy releases outline local economic outlooks and central bank strategies.
  • BOJ Press Conference: Statements from bank leadership offer clarity on domestic monetary policy direction.
  • BOJ Policy Rate: Interest rate decisions alter yield differentials and impact overall currency strength.

Weekly Outlook and Consideration:

The weekly outlook for USD/JPY suggests a cautious technical landscape. With the price hovering at 154.418 near the lower Bollinger Band of 153.513 and an RSI of 31.419 reflecting near-oversold conditions, a period of consolidation or a temporary pullback toward the 157.919 middle band may occur. However, with the MACD firmly at -1.485, bearish sentiment persists. A break below the support level of 152.878 could signal further downside risks, whereas sustained upside momentum would be required to challenge resistance at 163.973.

Disclaimer: The analysis provided for USD/JPY is for informational purposes only and does not constitute investment advice. Traders are encouraged to perform their own analysis and research before making any trading decisions. Market conditions can change quickly, so staying informed with the latest data is essential.
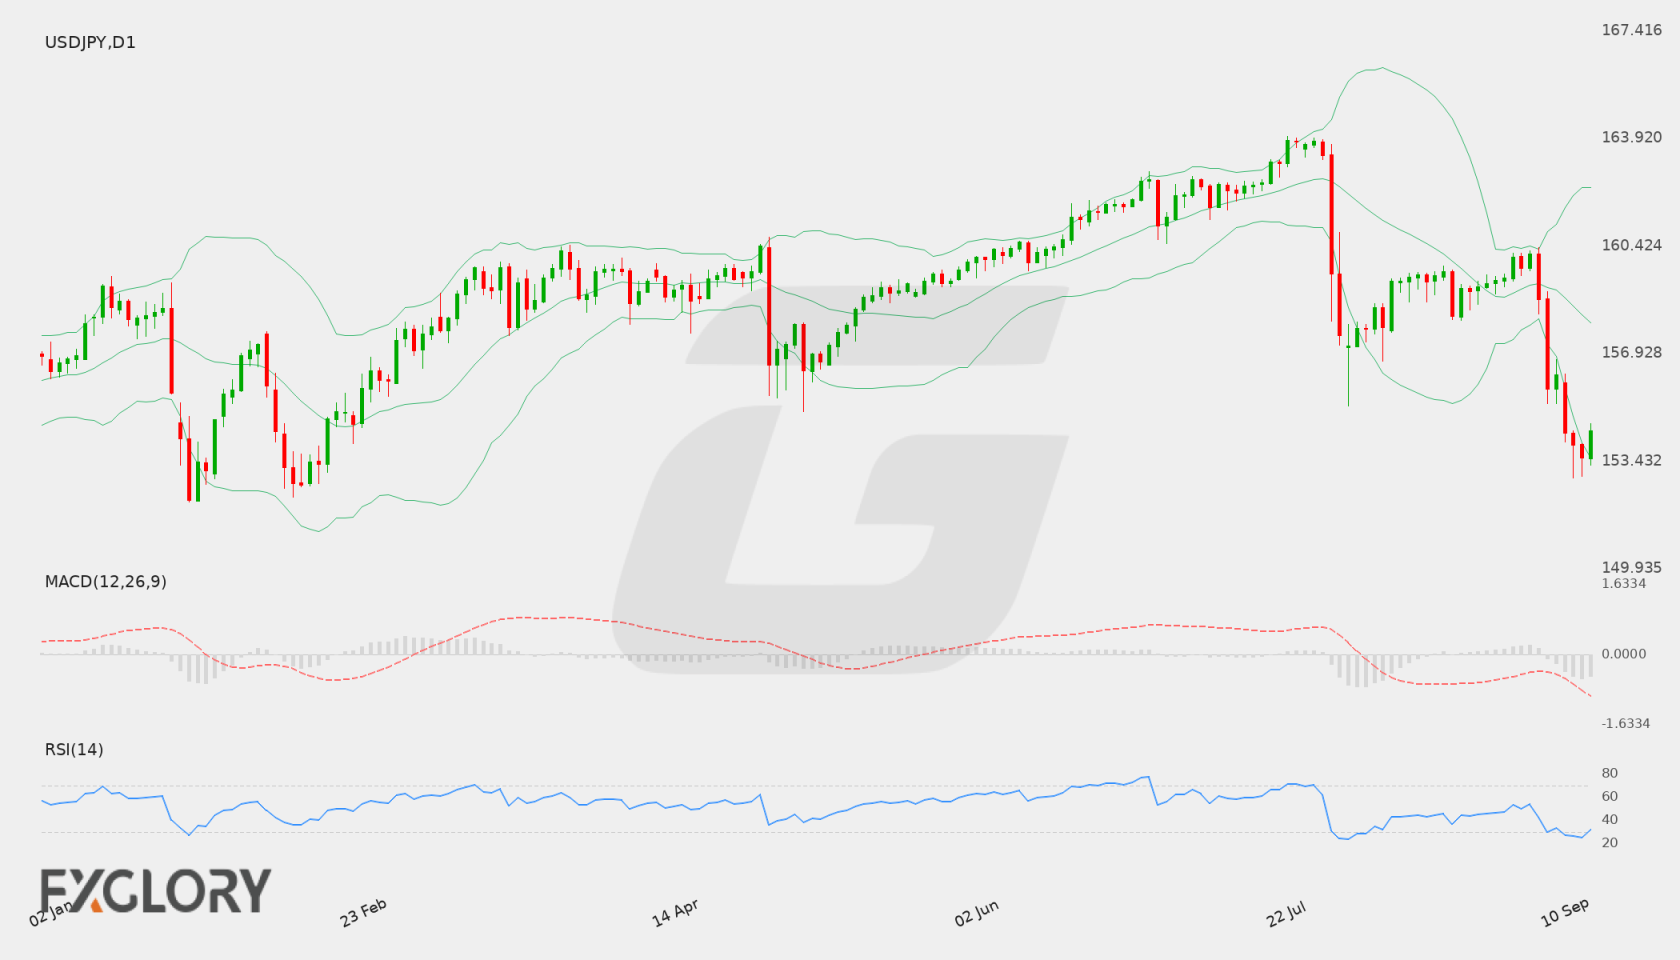
USD/JPY D1 technical analysis chart
USD/JPY D1 Technical Analysis for 09.12.2026

USD/JPY Forecast — 1 September 2026

Time Zone: GMT +3

Time Frame: Daily (D1) / Weekly Outlook

Weekly Fundamental Overview:

USD/JPY is currently trading in a consolidated structure as market participants evaluate economic conditions in the United States and Japan. Interest rate expectations and overall risk appetite continue to influence the pair’s broader direction.

Price Action:

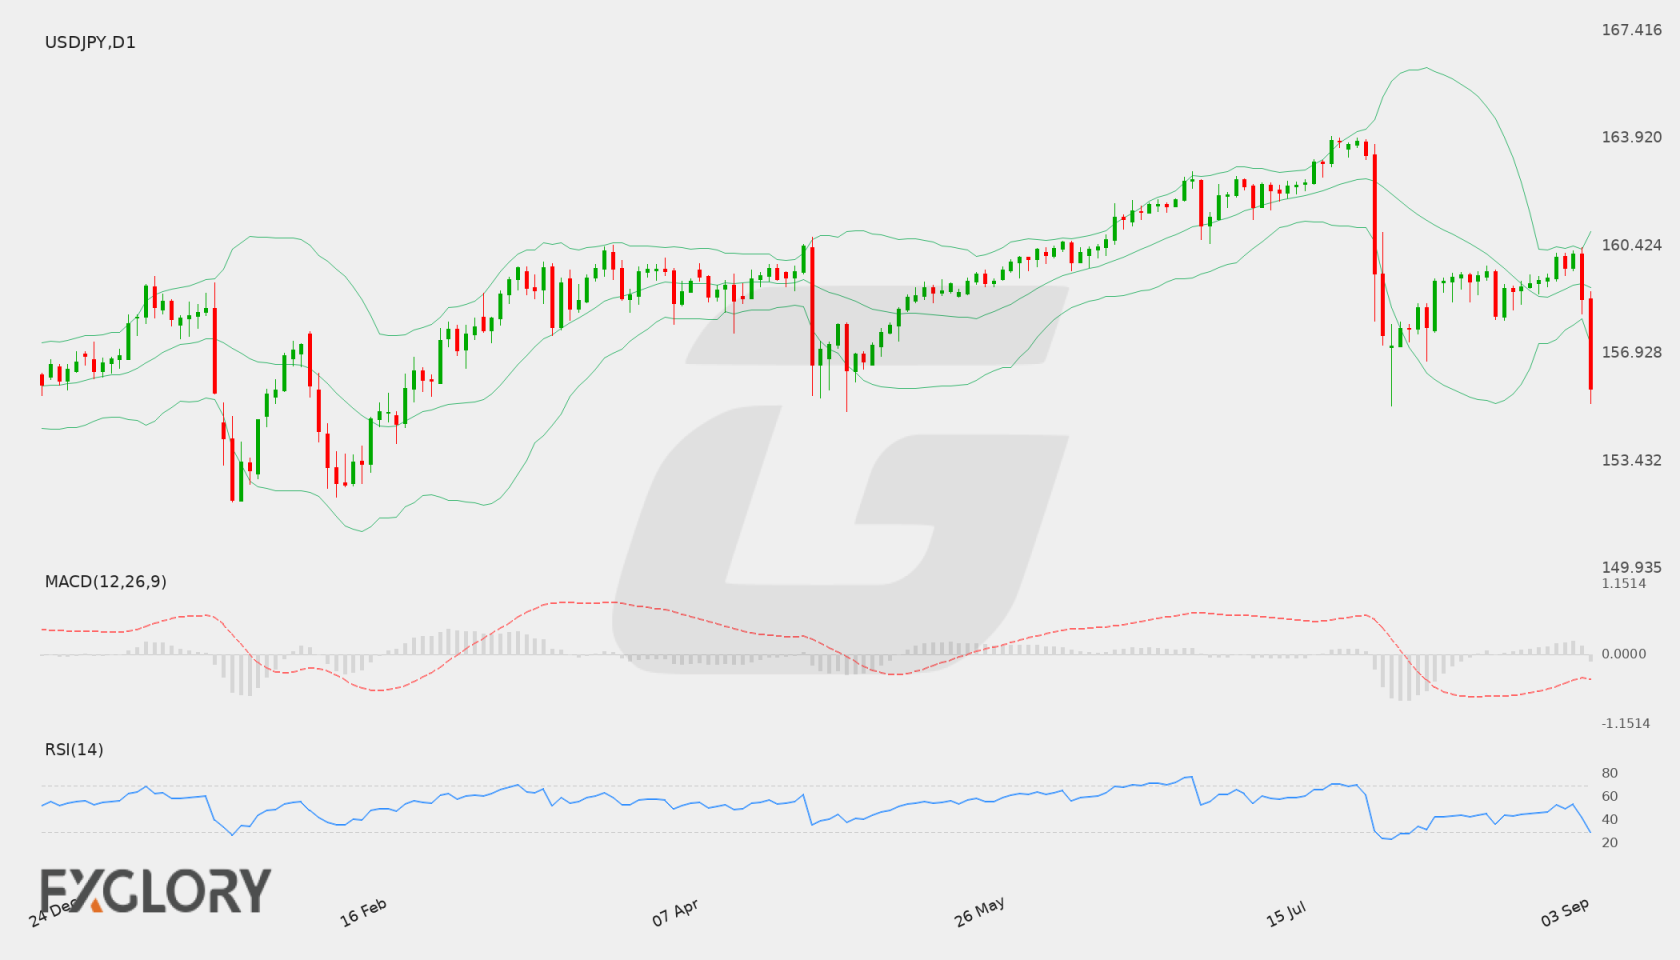
On the daily (D1) chart, USD/JPY closed at 159.723 after ranging between a daily high of 160.184 and a low of 159.464 in the latest session. Price action indicates steady consolidation within the recent range.

Key Technical Indicators:

Bollinger Bands: The daily Bollinger Bands feature a middle line at 159.017, an upper band at 160.348, and a lower band at 157.686. USD/JPY trading at 159.723 keeps price action comfortably positioned in the upper half of the band range.

RSI: The 14-period Relative Strength Index (RSI) registers at 49.985. Sitting right at the neutral 50 level, the indicator signals a lack of strong directional bias from either buyers or sellers.

MACD: The MACD indicator is currently at -0.291, remaining below the signal line in negative territory. This suggests that underlying downside momentum has not been fully cleared despite recent price stability.

Support and Resistance:

Key technical levels for USDJPY on the daily timeframe highlight primary support at 155.214 and primary resistance at 163.973.

News to Watch for USDJPY This Week:

  • ISM Services PMI: This release measures non-manufacturing business activity and can provide insight into economic momentum and future interest rate policy expectations.

Weekly Outlook and Consideration:

USD/JPY enters the week trading near 159.723, holding above the daily middle Bollinger Band of 159.017. Neutral RSI values around 49.985 alongside a negative MACD of -0.291 reflect balanced market conditions. A sustained break above the upper Bollinger Band at 160.348 could clear a path toward primary resistance at 163.973. Alternatively, a move beneath the middle band could shift focus back toward primary support at 155.214.

Disclaimer: The analysis provided for USD/JPY is for informational purposes only and does not constitute investment advice. Traders are encouraged to perform their own analysis and research before making any trading decisions. Market conditions can change quickly, so staying informed with the latest data is essential.
USD/JPY Forecast — 5 September 2026

Time Zone: GMT +3

Time Frame: Daily (D1) / Weekly Outlook

Weekly Fundamental Overview:

USD/JPY remains sensitive to scheduled market events and broader risk sentiment. Traders should watch high-impact calendar releases and USD movement where relevant before forming a directional view.

Price Action:

USDJPY is trading near 155.792, with current daily movement framed by nearby support and resistance.

Key Technical Indicators:

Bollinger Bands: Price is being assessed against the 20-period Bollinger Bands, with middle band near 159.0556, upper band near 160.89884750373, and lower band near 157.21235249627.

RSI: RSI(14) is near 29.472577618071, suggesting traders should watch whether momentum holds, reaches overbought pressure, or weakens toward oversold territory.

MACD: MACD is near -0.52815861705071, so momentum should be watched for continuation or loss of strength on the daily chart.

Support and Resistance:

Key support is near 155.214, while key resistance is near 163.973.

News to Watch for USDJPY This Week:

  • Watch scheduled high-impact releases, central bank comments, and broader risk sentiment this week; no specific calendar events are available in current plugin data.

Weekly Outlook and Consideration:

USD/JPY may remain guided by daily price action, support and resistance reactions, momentum indicators, and supplied calendar events. Traders should wait for confirmation around key levels and avoid assuming that current conditions guarantee the next move.

Disclaimer: The analysis provided for USD/JPY is for informational purposes only and does not constitute investment advice. Traders are encouraged to perform their own analysis and research before making any trading decisions. Market conditions can change quickly, so staying informed with the latest data is essential.

USD/JPY D1 technical analysis chart
USD/JPY D1 Technical Analysis for 09.05.2026

USD/JPY Forecast — 22 August 2026

Time Zone: GMT +3

Time Frame: Daily (D1) / Weekly Outlook

Weekly Fundamental Overview:

USD/JPY dynamics remain heavily influenced by overall US economic performance and sentiment regarding interest rate differentials. Key US economic indicators, including inflation gauges, economic growth figures, and employment data, could drive volatility for the USDJPY pair as traders assess broader macroeconomic conditions.

Price Action:

On the daily D1 chart, USD/JPY (USDJPY) recently experienced a pullback from key high levels near 163.973, settling around the 159.044 close. Price action reflects a period of consolidation following a slide toward support near 155.214, with market participants evaluating whether buyers can build momentum above recent low points.

Key Technical Indicators:

Bollinger Bands: The daily Bollinger Bands reflect a middle line at approximately 159.682, with the upper band at 163.963 and the lower band at 155.401. Trading around 159.044 places USD/JPY slightly below the middle band, indicating a relatively neutral posture within the wider band range.

RSI: The 14-period Relative Strength Index (RSI) stands at 44.00, placing USD/JPY in neutral territory below the 50 mark. This indicates that the pair is neither overbought nor oversold on a daily basis, leaving scope for technical moves in either direction.

MACD: The MACD indicator is currently at -0.660, holding below the zero line. This negative reading signals lingering downside momentum following recent price drops, though any potential convergence could suggest market stabilization.

Support and Resistance:

Key technical levels for USD/JPY include primary support at 155.214, aligned closely with the lower Bollinger Band at 155.401. On the upside, major resistance is established at 163.973, with dynamic resistance located around the middle Bollinger Band at 159.682.

News to Watch for USDJPY This Week:

  • CB Consumer Confidence: Shifts in consumer sentiment offer insights into household economic outlooks and dollar demand.
  • Core PCE Price Index m/m: As a key inflation indicator, this report can significantly influence monetary policy expectations.
  • Prelim GDP q/q: Updated growth figures provide crucial context on economic performance and currency valuation.
  • Prelim GDP Price Index q/q: Reflects underlying price developments within overall national economic output.
  • Unemployment Claims: Weekly jobless claims offer a timely pulse on labor market health and short-term volatility.
  • Prelim Benchmark Payrolls Revision: Adjustments to historical employment data can alter medium-term expectations for labor market strength.

Weekly Outlook and Consideration:

The weekly outlook for USD/JPY (USDJPY) points toward continued consolidation with potential sensitivity to upcoming economic catalysts. With the pair close to 159.044, a sustained break above the middle Bollinger Band at 159.682 could open the path toward upper resistance at 163.973. Conversely, if downward pressure resumes, price action may test lower support near 155.214. Market participants should monitor both technical indicators and incoming economic releases for clearer direction.

Disclaimer: The analysis provided for USD/JPY is for informational purposes only and does not constitute investment advice. Traders are encouraged to perform their own analysis and research before making any trading decisions. Market conditions can change quickly, so staying informed with the latest data is essential.

USD/JPY Forecast — 15 August 2026

Time Zone: GMT +3

Time Frame: Daily (D1) / Weekly Outlook

Weekly Fundamental Overview:

The USD/JPY currency pair reflects ongoing market dynamics driven by economic data releases from the United States and global risk sentiment. Traders are monitoring potential shifts in monetary policy expectations as upcoming US economic disclosures, including labor benchmarks and central bank minutes, provide signals regarding the strength of the US dollar against the Japanese yen.

Price Action:

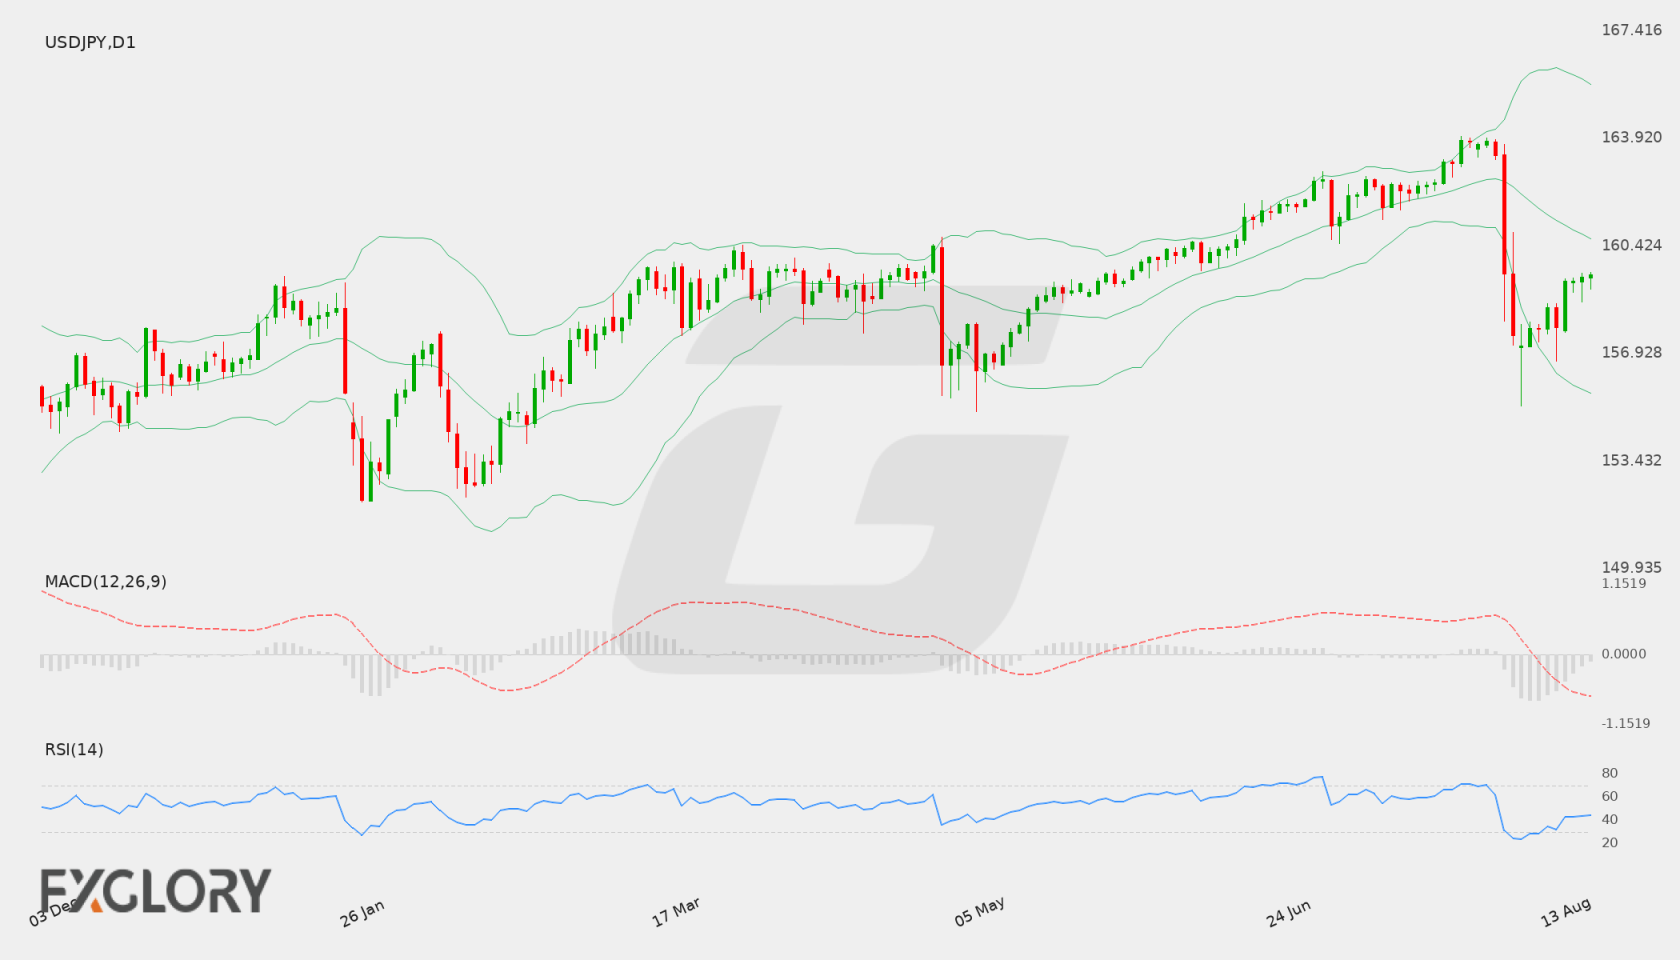
On the daily (D1) timeframe, USD/JPY recently experienced a pullback from highs near 163.832 toward a recent swing low of 155.214 before consolidating back to close at 159.481. Price action shows a series of recent higher daily closes following a sharp dip, placing the pair in a neutral consolidation phase below recent peak levels.

Key Technical Indicators:

Bollinger Bands: The daily Bollinger Bands display a middle band at approximately 160.657, an upper band at 165.679, and a lower band at 155.635. With the last close at 159.481, USD/JPY trades below the middle band, suggesting price is positioned in the lower portion of its recent volatility range.

RSI: The 14-day Relative Strength Index (RSI) stands at 44.147. This level places the oscillator in neutral-to-bearish territory, well away from extreme oversold or overbought thresholds.

MACD: The D1 MACD indicator shows a reading of -0.8011, residing below the zero line. This negative value indicates that medium-term momentum remains tilted slightly to the downside following the recent drop from higher levels.

Support and Resistance:

Key technical levels on the daily chart show main support situated around 155.214, which aligns closely with recent swing lows. Overhead resistance is established at 163.973, marking the upper boundary of the pair’s broader price movement.

News to Watch for USDJPY This Week:

  • Prelim Benchmark Payrolls Revision: This revision offers insight into US labor market performance and may influence rate expectations.
  • FOMC Meeting Minutes: The release provides detailed perspectives from central bank officials regarding future monetary policy path.
  • Unemployment Claims: Weekly jobless data reflects ongoing conditions in the labor market.
  • Philly Fed Manufacturing Index: This indicator measures regional manufacturing sector activity in the United States.
  • Flash Manufacturing PMI: Early purchasing managers index data highlights current sentiment across US manufacturing businesses.

Weekly Outlook and Consideration:

Trading in USD/JPY remains bound between key technical parameters, with D1 support at 155.214 and resistance at 163.973. Given that the pair closed at 159.481 beneath its middle Bollinger band of 160.657, alongside a negative MACD (-0.8011) and an RSI of 44.147, near-term price behavior exhibits mild downside sentiment. Volatility could increase as upcoming macroeconomic events influence USD valuation.

Disclaimer: The analysis provided for USD/JPY is for informational purposes only and does not constitute investment advice. Traders are encouraged to perform their own analysis and research before making any trading decisions. Market conditions can change quickly, so staying informed with the latest data is essential.

USD/JPY D1 technical analysis chart
USD/JPY D1 Technical Analysis for 08.15.2026
1USD = –––JPY –––%
USDJPY
Loading chart...